Leggi questo articolo in Italiano

Fear and greed Index: what is it?
By Gabriele Brambilla
An easy-to-read and well-known indicator, the Fear and Greed Index is a classic on a variety of analysis portals, news outlets, and exchanges
What is the Fear and Greed Index?
Important for assessing market sentiment, the Fear and Greed is one of the best known and easiest indicators to read. Let’s understand what it is and how it works.
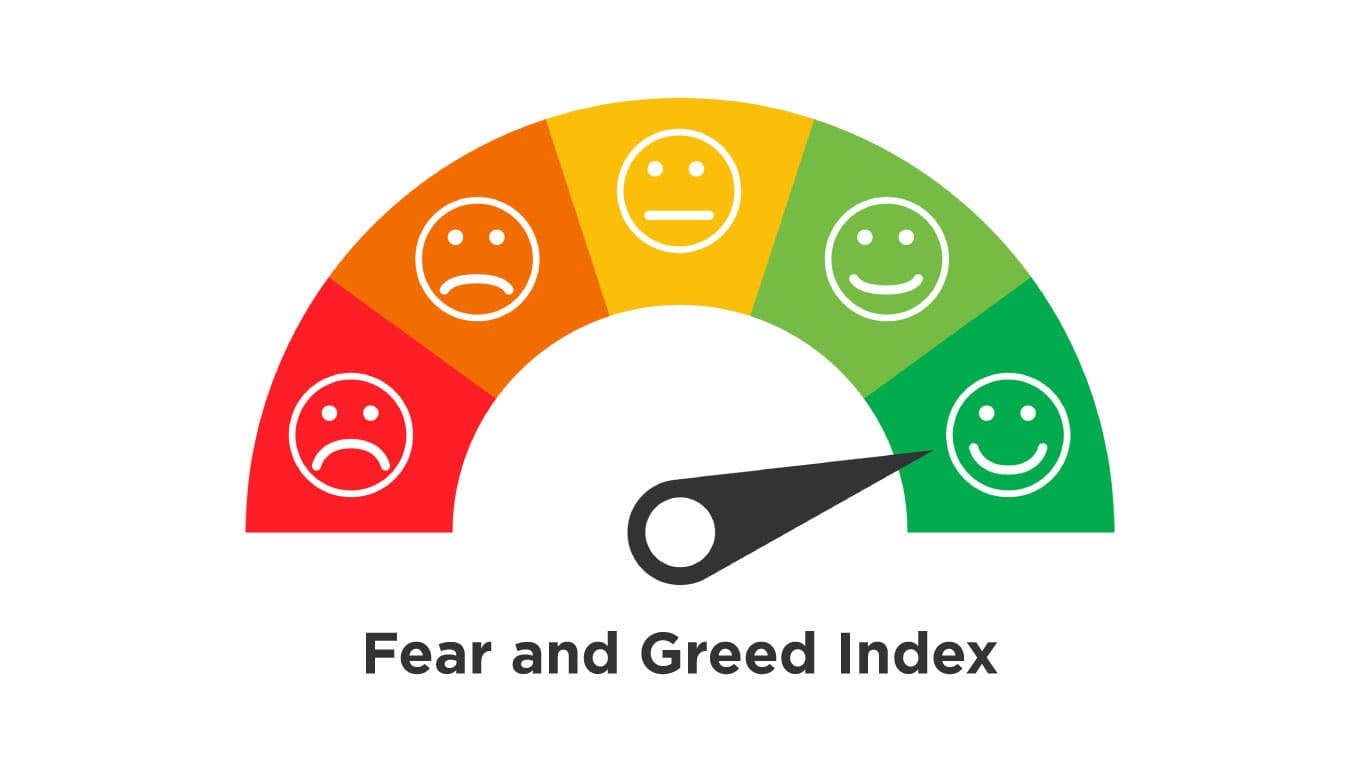
The Fear and Greed Index consists of a number between 0 and 100, where 0 expresses extreme fear and 100 extreme greed. Neutrality is in the middle, and in the middle are all the nuances.
The figure is meant to represent market sentiment and to understand whether assets are priced in the right way. The idea behind it is quite basic: too much fear pushes prices down, while too much greed will send them up.
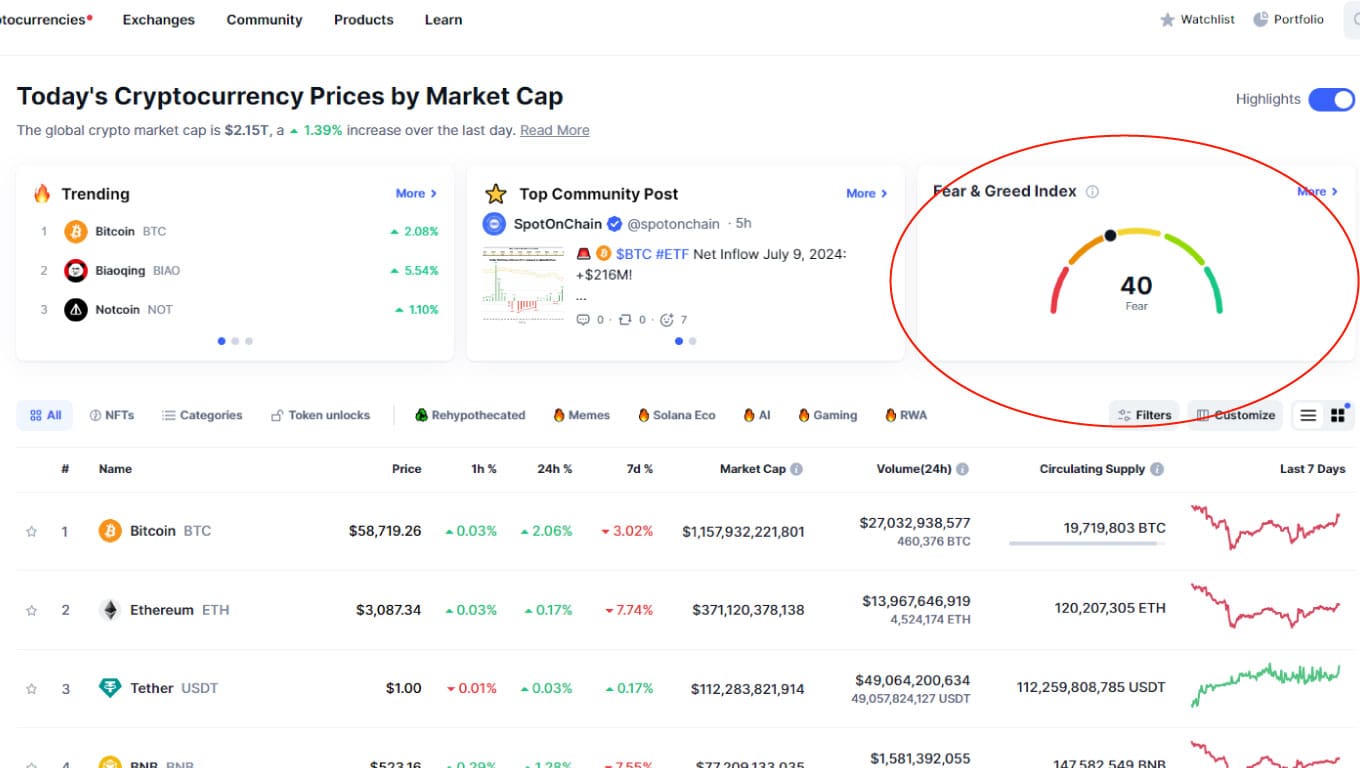
The indicator originated in the world of stocks, and then spread elsewhere. In our field, the Fear and Greed crypto is now a certainty, found on exchanges and portals such as CoinMarketCap and CoinGecko.
Keeping track of the value is important because it can give useful signals to the investor or trader. In fact, while it is true that fear calls for more fear, too low a Fear and Greed could indicate imbalance and the possibility of buying at a discount. Conversely,excess greed can be read as a wake-up call about possible corrections coming.
How to calculate the Fear and Greed Index
We find the “ready-made” Index on numerous portals, so we will never have to calculate it. However, let’s find out what it is based on and how it is created.
One of the most famous F&Gs is the one developed by CNN and is based on seven other indicators. Each of these detects certain aspects of behavior in the stock market. Specifically, the indicators are:
- Market volatility;
- Safe haven demand;
- Market momentum;
- Stock price strenght;
- Put/call options;
- Junk bond demand;
- Stock price strenght.
The data are monitored and their variation from the mean, as well as the average variation is measured . After that, the results obtained are merged together by assigning them equal weight. The final data will be a number between 0 and 100, which is precisely the Fear and Greed Index.
The updating is constant.
How to use it?
Basing choices on Fear and Greed alone would be erroneous, as it cannot offer the full picture of the situation.
However, the indicator is very useful when employed in combination with other fundamental and technical data. It can provide insights to think about because it is capable of showing at a glance what the average market sentiment is. Since most investors act (wrongly) from the gut, getting caught up in their emotions, the Fear and Greed Index is definitely a valuable support.
Depending on the asset we are gathering information on, the Fear and Greed changes. For example, we might consult the one from CNN for the stock segment (especially U.S.), while we will have to opt for CoinMarketCap for the crypto Fear and Greed (see below). Other solutions include that of Binance, specific to the exchange, however.
However, let us avoid overemphasizing this specific data: if we have done all other analyses well and are convinced of our actions (and risks), we may still proceed regardless of what fear and greed tell us.