Leggi questo articolo in Italiano

GDP: Gross Domestic Product 101
By Gabriele Brambilla
Often featured in the mainstream media as well, Gross Domestic Product (GDP) is one of the basic figures of the macroeconomic world: let's delve into it

GDP: one of the main economic indicators
Raise your hand if you have never heard of GDP, or Gross Domestic Product; probably no one has raised it, because we are talking about one of the most important economic indicators.
The economy cannot be represented by a single figure; it requires a wide range of numbers to be able to take a snapshot of the situation. Moreover, there still remain limitations that require other types of indicators beyond this sphere.
However, Gross Domestic Product is undoubtedly fundamental to understanding the direction in which a country is going, so we need to know what it represents. In this article we discover the GDP meaning, plus other useful and interesting concepts.
Index
What is GDP?
Let’s start with the GDP definition; Gross Domestic Product is a macroeconomic figure that measures the aggregate value of all goods and services produced in a certain territory and in a very specific time period. Important: the goods and services must be final, so not at an intermediate stage of the production process.
For example: if we manufactured toasters, these would be the final product contributing to GDP.
As stated in the definition, GDP refers to a very specific territorial area. If an American company also had a location in Italy, what it produced would add to the Italian Gross Domestic Product, not the American Gross Domestic Product. This concept is particularly important because it highlights what GDP is intended to represent, with all the implications that go with it.
If we think about it, Gross Domestic Product is a litmus test of a country’s economic activity and also provides relevant indications of the labor market, with consequences for consumption as well. This is because, at least theoretically, as GDP increases, productivity, employment and consumption increase, creating a circle that feeds the Gross Domestic Product itself.
GDP is considered one of the most important macroeconomic data of all, capable of representing a country’s level of well-being. In truth, this is not always the case, but we will return to this later.
GDP formula: how to calculate gdp
GDP is calculated using a formula well known to those who have studied economics, as it is one of the first you encounter on the route. Here it is:
Y = C + I + G + NX
Let’s understand what these letters mean one by one:
- C: consumption
- I: investment (private)
- G: spending (understood as government spending);
- NX: net exports, i.e., the result of imports-exports (let’s talk about Trade Balance, an equally relevant figure for insiders).
Through this formula we obtain the Gross Domestic Product, which, as seen, is based on the territoriality criterion (producing something in a territory adds up to the GDP of that territory).
Then there is also the Gross National Product, also known as GNP. This drops the territoriality criterion and establishes that of nationality. Returning to the example of the American company, what is produced in Italy would go to:
- Add up to the Italian GDP;
- Add up to the American GNP.
"Fundamental to the difference between GDP and GNP: they are two quite distinct figures!"
Nominal GDP and real GDP
Gross Domestic Product can be measured in two ways: nominal and real.
The former is represented by a value measured on current prices, while the latter takes into account changes in prices.
There is no one best solution: it will be up to the person reading the figure to choose which one best suits his or her needs, considering also the periods taken into account. For example, when prices fluctuate a lot, real GDP may be more suitable for some research, so as to eliminate the noise given by changes.
Therefore, nominal GDP can vary both by the quantities of goods and services produced and by changes in prices. In contrast, the real one shows exclusively changes in the quantity of goods and services produced. The advantage of real GDP lies in the ability to compare different vintages regardless of context.
GDP by country
There are various rankings compiled by various organizations such as the International Monetary Fund, the World Bank and so on. The numbers change significantly, but the positions remain more or less the same.
In first place, of course, is the United States (US GDP), the largest economy on the entire planet. Alone, they contribute between about 17 and 23 percent to the Gross Domestic Product .
In second place, detached, is the European Union. In truth, not being a country, the position is occupied virtually.
The real second place belongs to China (China GDP), which contributes between 12 and a meager 16 percent to world GDP.
It is followed by Japan, Germany and the United Kingdom, with values less than half that of China.
The (nominal) data refer to different periods, all prior to the pandemic.
Focusing on our home, who has the highest GDP in Europe? The answer, rather predictably, is Germany.

GDP per capita
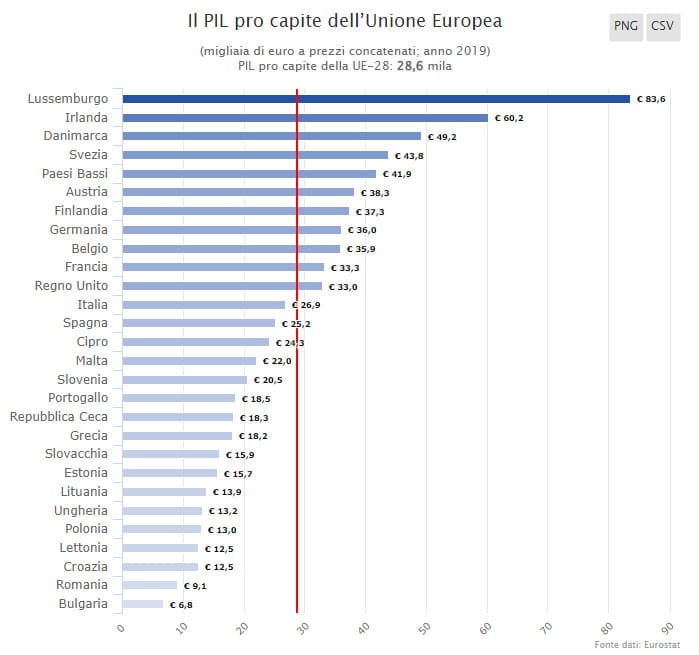
If we take GDP and relate it to the number of inhabitants, we get GDP per capita. It can give an idea of the average standard of living in a given country, although it clearly cannot show disparities.

GDP per capita ranking
Continuing with the rankings, the highest nominal Gross Domestic Product per capita belongs to Luxembourg, ahead of Liechtenstein and Switzerland. United States in tenth place, Germany in nineteenth, and Italy in twenty-eighth.
The data come from the International Monetary Fund and are based on the 2018-2022 period.
GDP Limitations
Now that we know what GDP means, as well as what revolves around this concept, we just have to talk about limits.
This indicator is fundamental in economics and has always been seen as representative of a country’s well-being. However, this is not entirely true.
First of all, the number cannot represent the inequalities present in a state. For example, it does not show data such as the poverty line and the percentage of the population that is below it. We should therefore supplement the figure with other indicators to get a true picture of what is happening behind the scenes.
Gross Domestic Product is then a value that aims so much to represent growth and economic development, but these are often at the expense of other equally (if not more) important items.
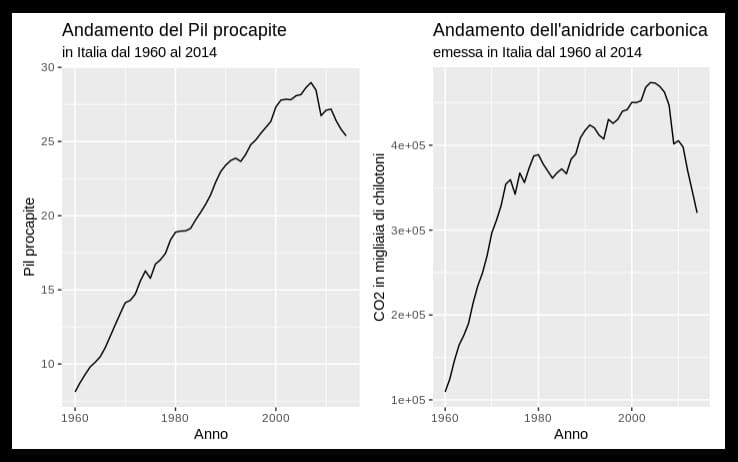
One example is the correlation between GDP and levels of carbon dioxide, among the main greenhouse gases responsible for climate change. As Gross Domestic Product increases, greenhouse gases grow and human-caused extreme phenomena worsen, causing damage not only to ecosystems but to humans themselves.

Image source: G273Y on Wikimedia Commons.
Looking at the image above, the trend in GDP is shown on the left side, while on the right side we find the trend in carbon dioxide emitted. We easily notice the correlation between the two figures, a sign that we need to review our production processes and methods of assessing welfare, at least in part.
But there is more. GDP shows only money-related figures, but it does not take into account people’s happiness, access to services and other key factors in the well-being of individuals.
For this reason, there are other indicators such as the Indicator of Real Progress (IPR) or theHuman Development Index. They seek to include factors beyond economic measures, with the idea of better framing the situation in a given area.
Gross Domestic Product remains a cornerstone of the economic world, which we must follow with particular attention since it can also affect markets in no small measure. Let us not forget, however, to go further and investigate more deeply; otherwise, we will have clear only one side of the coin, while being unaware of the other.