Traders and time frame
In this article we will discover all the basic fundamentals related to price action and market structure.
Every trader in approaching the market should ask himself fundamental questions, regarding his/her predisposition to risk, the time horizon of his/her trades, and his/her availability of time to spend on the chart.
The answers to these questions qualify a trader in several respects: how he/she will set his strategy, what his/her goals will be, and what his/her returns will be.
From a time perspective, a trader can be:
- Scalper: very short-term trades, 5-minute (or lower) time frame, usually up to max 1h;
- Intraday trader: short-term trades, 15min time frame (or lower) , usually up to max D;
- Swing Trader: medium-term trades, time frame from 1h up to weekly;
- Position Trader: long-term trades, time frame D-W-M (day, week, month).
Index
Fractality and HTF domain
Regardless of the operating time frame one prefers, the hierarchy governing price movement cannot be ignored:
- In a weekly candle, there are 7 D candles (in the traditional market 5)
- In a D candle, 6 H4 candles
- In an H4 candle, 4 H1 candles, and so on
This is to say that in any evaluation of price trend, one must consider that the upper time frames dominate over the lower time frames.
In a strategy that operates only in trend following, for example, the market bias, and thus the directionality of the positions, will be established on the higher TF based on our time goal.
Market Structure
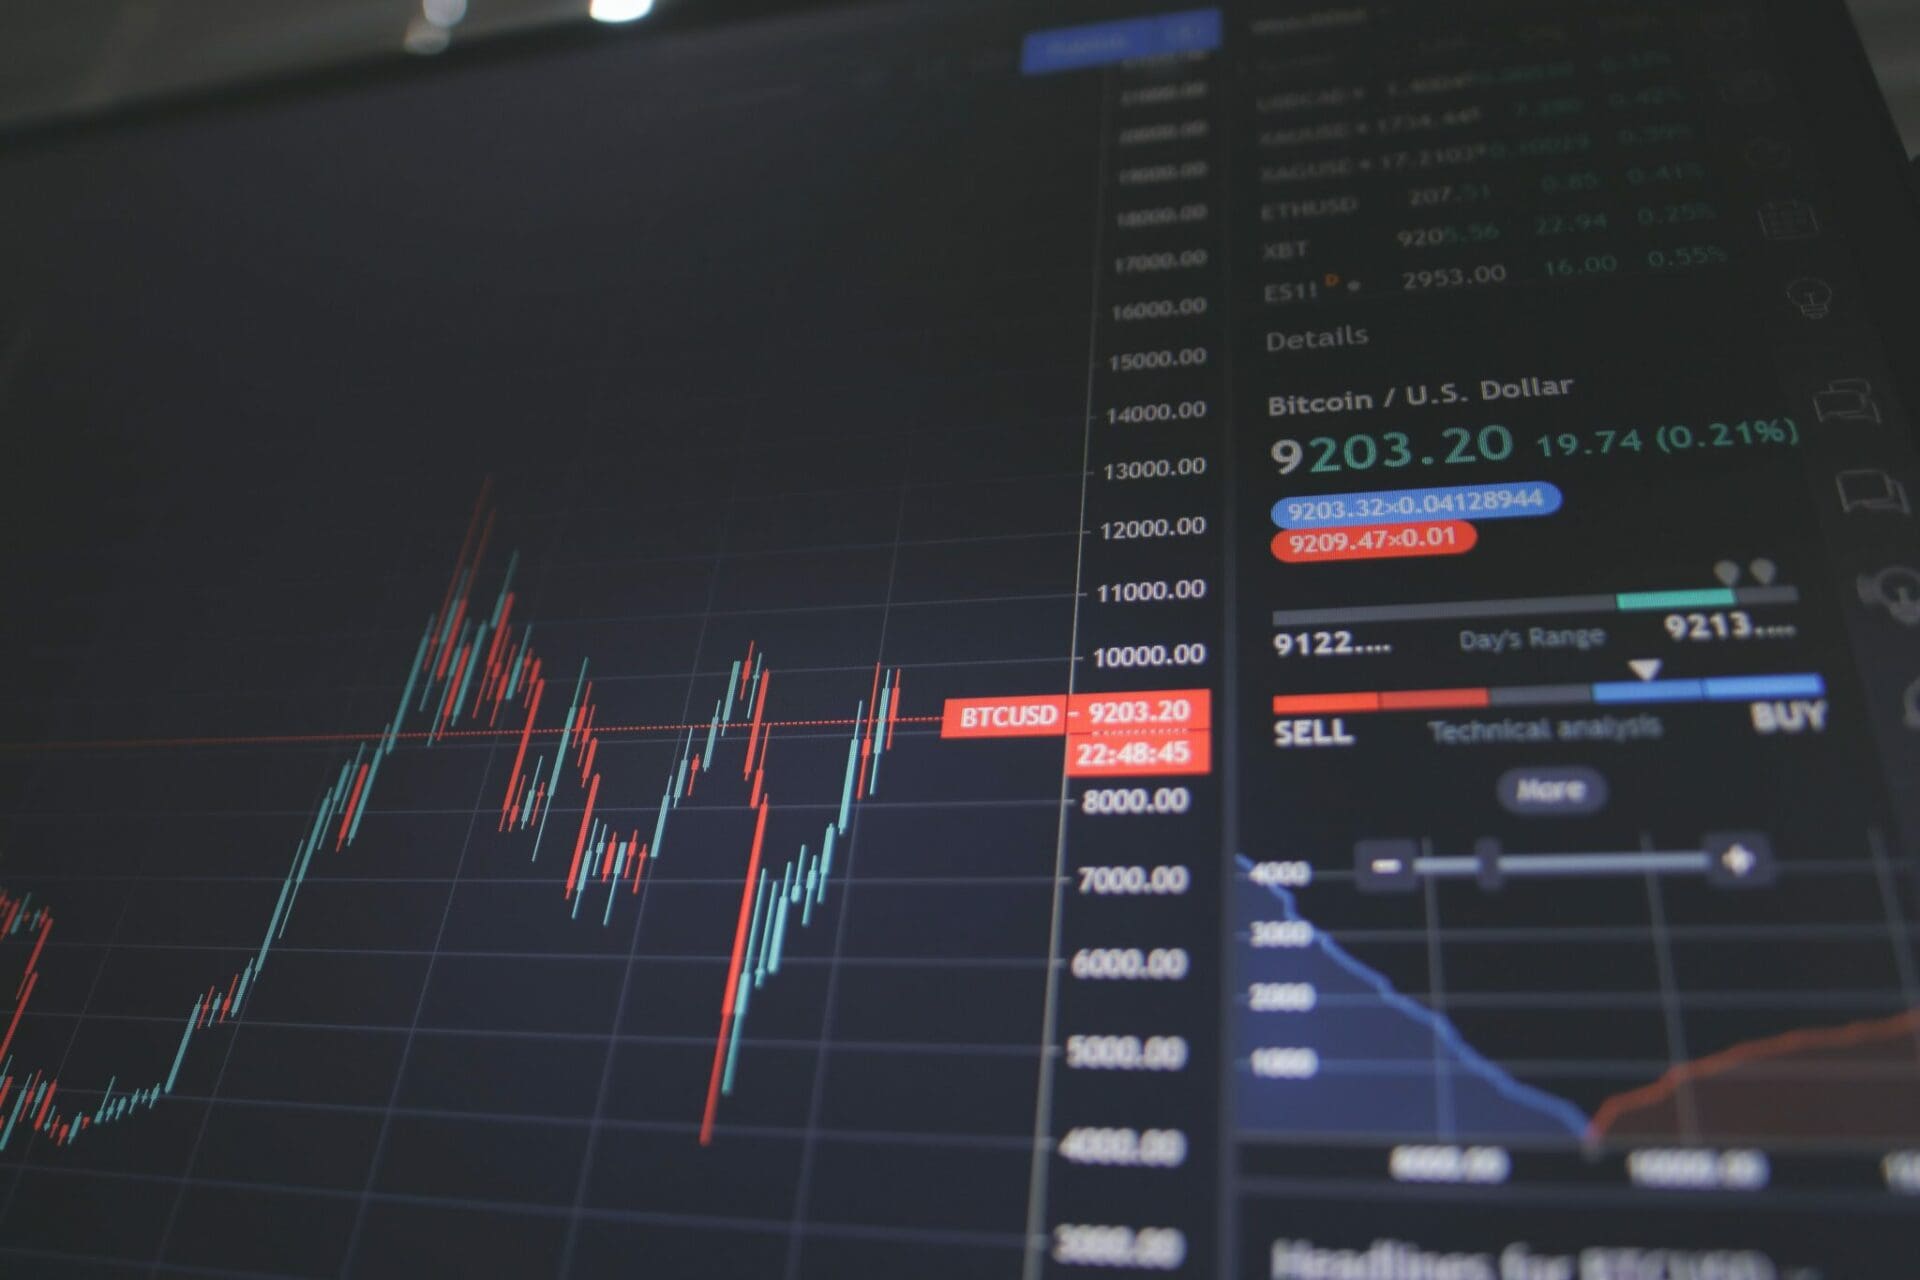
The chart of an asset (Candles, Line, Heikin Ashi) is nothing more than a representation of the dynamics between buyers and sellers at various price levels.
The market structure generally follows three trends:
- Bullish: excess demand;
- Bearish: excess of supply;
- Lateral: essential parity between buyers and sellers.
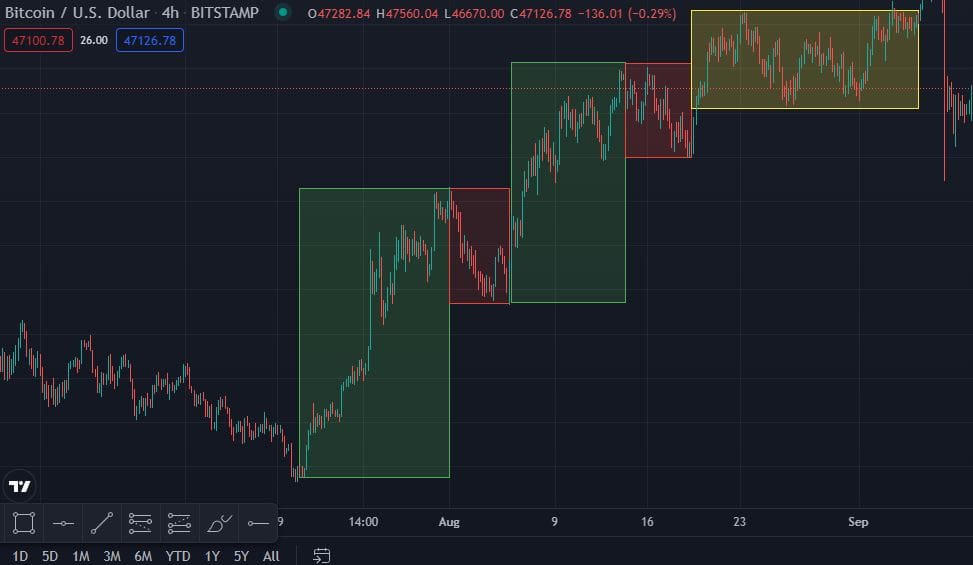
In each of these phases, the market alternates between directional impulses and retracements, in bullish markets they follow each other in rising highs and rising lows, in bearish markets in falling highs and falling lows while in a sideways market we basically have the price fluctuating within a more or less wide price range.
Price Reaction Zones
Another fundamental element in the creation of an operational bias is the identification of potential price reaction zones, the so-called PRZs (potential reversal zones).
In a strongly algorithmic market , it cannot be ignored that there are well-defined zones in which price tends to have reactions, more or less strong, given by the operation of these software and the psychology related to determinant price levels.
These zones are qualified in different ways, and in the next section we will go on to identify what are the most common concepts related to PRZs.
Price action: rounds, half-rounds and quartiles
These Psychological Prices are often used by trading algorithms to take or unload positions, we see in each case that volumes near these price ranges are higher and tend to inverse the directionality of the market.
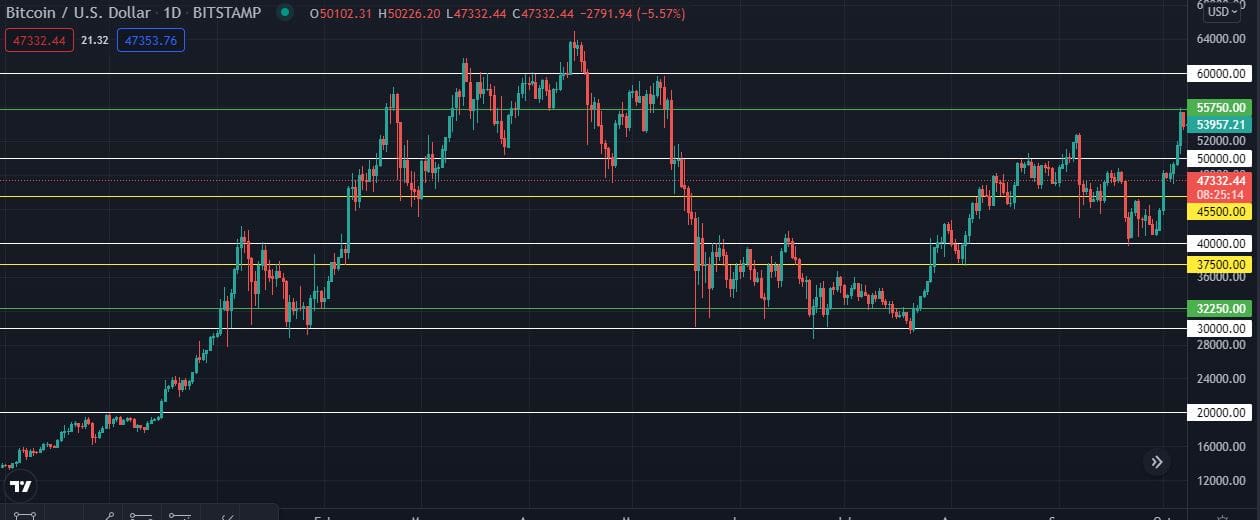
It can be seen with a quick examination of the price action of almost any asset, how in any bullish or bearish movement, round numbers, half-rounds and quartiles act as break and retest points or as reversal points of a given trend.
Psychological prices are nothing more than points where price tends to feel more pressure, below are a series of examples to better understand the classification:
ex. Asset with price <1;
- Round numbers= $0.1-$0.2-$0.3…
- Half round numbers= $0.15 – $0.45 – $0.05
- Quartiles= $0.25$ – $0.5$ – $0.75
Ex. Asset with price >1;
- Round numbers= $1 – $2 – $30,.
- Half round numbers= $15 – $45 – $5.
- Quartiles= $25 – $50 – $75.
The theory of quartile numbers is very interesting and deepened by Ilian Yotov in “The Quarters Theory,” the pdf of which should still be downloadable online for free.
Another important reaction zone, but which we will not discuss here, is the so-called Supply/Demand zone.
Smart Money vs Dumb Money
As anticipated, the market structure tends to follow 3 phases:
- Bullish: succession of HH and HL;
- Bearish: succession of LH and LL;
- Lateral: Highs and lows in undefined succession and always within a range.
To qualify the alternation of these three phases, I would like to lean on the price movement dynamics theorized in the early 1900s by Richard Wyckoff.
Not to go into too much detail at this introductory stage, Wyckoff divides the market into two main players, Informed money and Uninformed money (Smart money and Dumb money).
Smart money are those who actually move the market because of the amounts of money at their disposal and the information they have about it. They ideologically represent that 10% of traders, who make money from the market.
Large investment banks, investment funds, and any “market player” that applies risk mitigation strategies, are all considered Smart Money.
You will then surely have read around, that 90 percent of traders lose 90 percent of their capital in the first 90 days, or something like that; here are these types of people who approach the market in an uninformed, or worse emotional way, are the Dumb Money.
They provide liquidity to the market by operating according to the traditional logic of technical analysis, now abundantly obvious and predictable, or without any kind of strategy and/or risk management, which makes them very easy prey for mistakes and failures.
Richard Demille Wyckoff
As we can observe from the image above, in Wyckoff ‘s schematics Smart Money is positioned to buy, in discount zones (where the market presents situations of unexpressed bullish potential) to sell, in highly premium zones (where the market presents unexpressed bearish potential).
Crucial, however, are the lateral phases , where according to Wyckoff enough liquidity is gathered at the dumb money to take directionality, in what sense?
The market is a zero-sum “war” for every bullet fired long there is someone who dies short and vice versa, in short, for every buyer there must be a seller.
And it is precisely in areas of laterality that smart money performs the so-called Accumulation/Distribution processes:
- They accumulate long/short positions
- They unbalance the range in the opposite direction
- They convince dumb money of a false directionality, then turn in the opposite direction.
- They progressively give up their positions until they get to the next area.
Now let’s face it, how many of us have been dumbed down over and over again by the market taking our SL before actually making the move we had in mind?
This happens because of the same dynamics we were talking about earlier: in order to go in one direction, smart money needs liquidity, and that liquidity is gathered (even) by going after our stop losses.

Conclusions on price action and market structure
I hope that some of you will someday really get to move so many assets and have such in-depth knowledge of the market that you can consider yourself smart money. Until then what I can advise you is to continue to study, understand and apply people’s strategies with results.
Do not operate according to emotionalism or advice from “who knows where,” run tests on the assets you want to trade with, take notes on frequently repeated situations and try to build a trading plan, which has a true Statistical edge on the market in question.
This is not enough; the market and the dynamics that move it are constantly evolving, adapting to the new strategies and approaches of its players. You have to stay abreast, keep studying and breathing the markets.