Leggi questo articolo in Italiano

Fibonacci retracements, history, trivia and practice
By Matteo Bertonazzi
We understand how Fibonacci retracements work and their history. Before online trading existed and before banking, a merchant from Pisa found a singular numerical relationship, the Fibonacci sequence

Introduction about Fibonacci retracements
Everything is number – Pythagoras
We start with this brief assumption about the matrix of what we are and what surrounds us, quoting a forerunner of the character we are going to talk about today and with a provocative question: is everything composed of numbers or is it just a language that our senses understand better? In other words, was the number born first or man?
Leonardo Pisano, known as Fibonacci, was born in Pisa around 1170. As a youth, he travelled the countries of the eastern Mediterranean, following his merchant father, who planned an education for him in the understanding of mathematics.
In doing so he hoped to benefit him in his career as a merchant, what he achieved instead was a revolution in the European metric system and a son consigned to history as a pioneer of mathematical and harmonic patterns.
Index
Fibonacci sequence
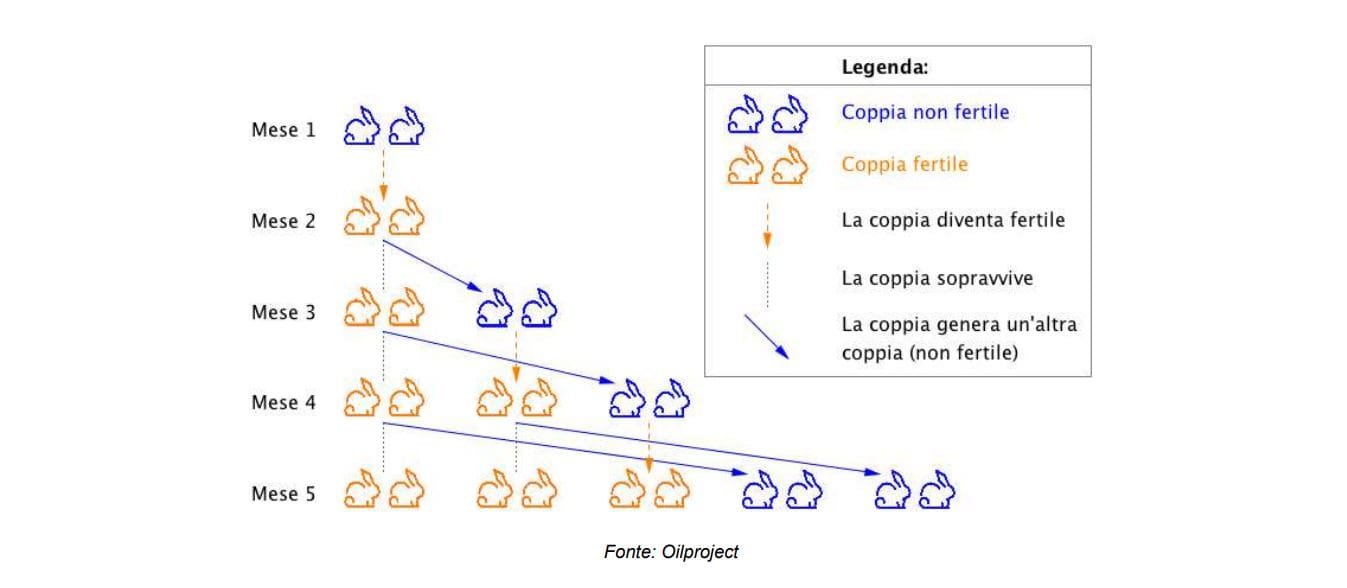
In the text Liber Abaci, Leonardo, besides being one of the first to bring Arabic numerals to Europe, drew attention to a problem, which became far more famous than the book itself, and was subsequently taken up by several authors: Fibonacci’s rabbit problem.
The question goes like this: How many pairs of rabbits will be born in a year, starting from a single pair, if each month each pair gives birth to a new pair that becomes productive from the second month?
To put it simply, each month we will have a number of pairs equal to the sum of the pairs of the previous two months.
This rabbit propagation logic was then summarised mathematically as the Fibonacci sequence: each successive number is the sum of the previous two 0 1 1 2 3 5 8 13 21 34 55 89 144 233

The Golden Section
Let us try for fun to construct squares with each number of the Fibonacci series on its side, the result would be as follows

If then in the corner of each square we were to fix a compass with a radius equal to the side, the end result would be this: The Golden Section.

The logic behind the Golden Ratio is harmony between the parts and balance.
This aspect added to the Fibonacci sequence leads us to the following insights:
- If you divide a number by the next number you get a constant, closer and closer to the number 1.618 as you progress through the sequence, it is this constant that provides balance to the relationships between the parts.
- The reciprocal of this number is 0.618 or 61.8% a famous level used in the Fibonacci retracement, as well as the initial level of the Golden Zone (zone of high reversal potential).
Practical applications of the Golden Section
This article is not intended to be a treatise on applied mathematics nor a eulogy to an ancient algebra genius, but a little general knowledge never hurts.
We started from the assumption of Pythagoras that Everything is number, and what better example to support this thesis than the golden section, which can be found in many areas of our lives, from the point where we accidentally decide to sit on an empty bench, to the shells of crustaceans, through galaxies, to the proportions of a chicken egg.
The Fibonacci succession and the Golden Section can also be found in human beings, the most fitting example being the hands: the ratio between the phalanges corresponds to the ratio between the numbers in the succession and guess if we shake our hand into a fist… Here is the Golden Section.
We have cited very few examples in which you can see the Fibonacci succession at work, but I urge you to do more in-depth research as it is a truly curious subject.
Fibonacci retracements
Now all that remains is to understand how to use this ‘mathematical magic’ in the area that interests us most: finance and markets.
Using the logic of Fibonacci, a software has been created, available free of charge on Trading View, called Fibonacci retracements.
I often like to repeat that the market always seeks harmony in alternating between impulsive and retracement phases.
This is why the use of Fibonacci retracements allows us to identify, depending on the specific asset on which we are backtesting, the harmonic level most statistically used by the asset to break the retracement and realign to the trend.
Trying to be more direct, this tool allows us to qualify an impulse (from the minimum to the maximum – long impulse, from the maximum to the minimum – short impulse) according to different levels % of retracement.
By analysing past data, we can find the most expected level, where the asset broke the pullback, and bring it as a confluence within our operational plan.

Fibonacci Leves
These levels are derived from the ratios between numbers in the sequence:
- 61.8% (0.6 18) is the reciprocal of the famous phi (1.618)
- The 38.2% level is derived from the ratio of alternating sequence numbers (8/21, 13/34 etc.),
- The 50% is not strictly a Fibonacci level but is used in the instrument as it represents the equilibrium/means point of the impulse we are qualifying, which often acts as a psychological level.
The rationale for using this instrument is to select the levels that are statistically most responsive and which indicate most accurately the breakout of the retracement.
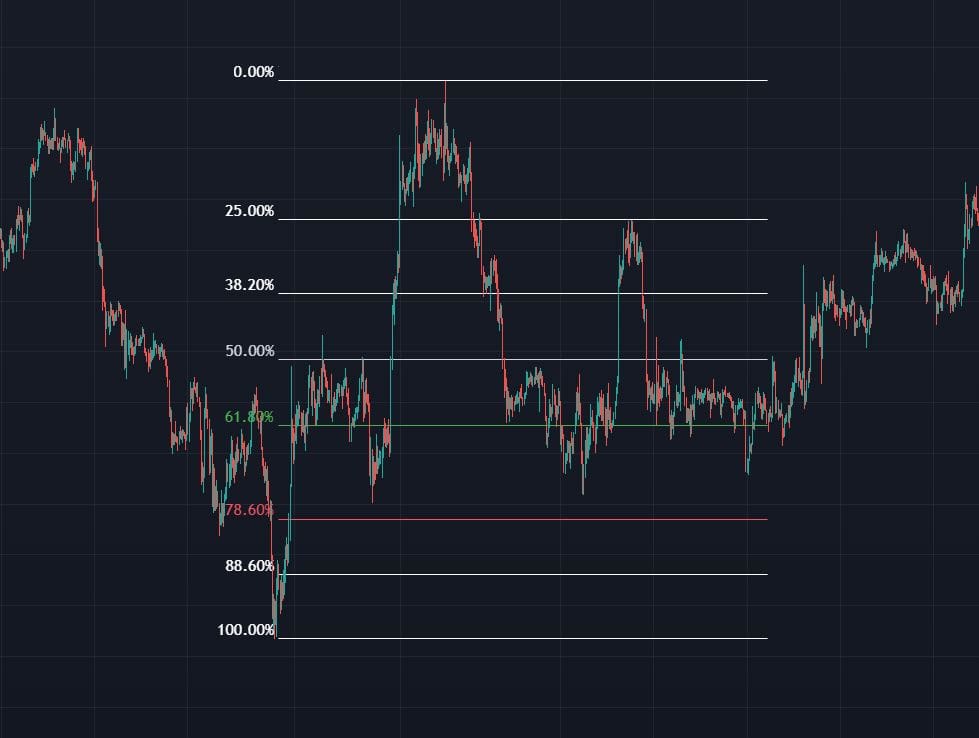
The Golden Zone, the area that proceeds from the 61.8% level to the 88.6% level, is the area that is statistically most reactive.
This is not a random datum but derives precisely from the logic of price movement: those who positioned themselves on an asset at the origin of the impulse and gradually unloaded profits during the impulse, will only be pleased to reposition themselves should the asset return to the discount zone.
"As we can see in the image, the tool qualifies the impulse (green) in different % levels, it is up to us to identify which have a greater reactive force on price"

Tutorial and customization
Let us now see how to customise our Fibonacci retracement tool, to be able to read and use it more easily. Below we can see how to correctly plot and identify the % retracement levels for a long trend:
Your Fibonacci will be set differently so here is a mini tutorial on how to make it more readable, obviously customisation depends on your personal taste
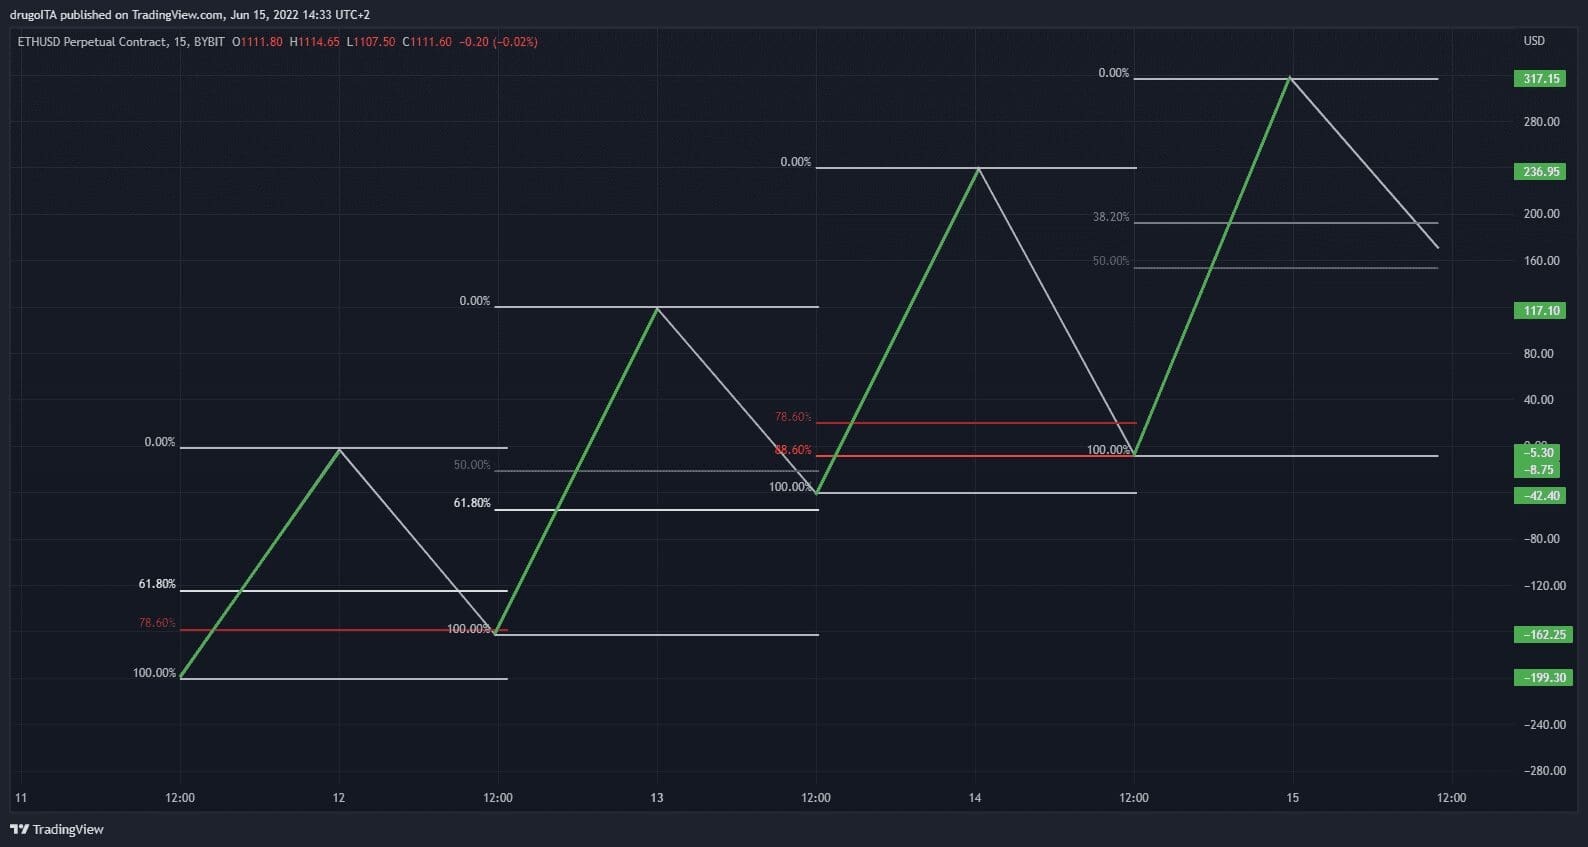
Let’s do some testing at lower time frames:
Conclusions
As you can see investor, the precision with which the retracement levels are respected is not random.
The more experience you gain with this type of instrument, the more you can customise it to your liking by identifying particular levels that you prefer to use, depending on the time frame or the asset in question.
Remember, each asset has its own characteristics, don’t assume that if you identify a level on e.g. BTCUSDT, then it will automatically work for ETHUSDT or AAVEUSDT as well, run the correct backtest on each asset in your watchlist and make your statistics customised.
That said, the applications of these concepts, as we have seen, can be found in numerous areas, try to find out in which other of your passions Fibonacci shows up and let us know during the live broadcasts or on our social channels, thank you for your attention.