Leggi questo articolo in Italiano

Technical analysis: a complete introduction
By Gabriele Brambilla
Technical analysis: a powerful tool serving every investor in cryptocurrencies, stocks and other assets. Beware, however, of confusing it with fundamental analysis!

What is technical analysis
Technical analysis is the painstaking study of charts and related indicators.
This type of research is especially useful in the short term and is of fundamental importance for all speculative trading.
In addition, technical analysis set over a longer time horizon is a valuable tool for medium- and long-term investors. In fact, by identifying the trend, it is possible to draw many conclusions about the health of the asset, setting possible corrective maneuvers.
Therefore, chart reading offers the best in short-term operations but is also very useful in the medium/long term, in support of fundamental analysis.
However, let us not limit ourselves to seeing it as a mere reading of numbers: technical analysis is also a real session of market psychology. With a well-done study we will be able to know the sentiment of other investors and take advantage of fear, euphoria and uncertainty.
In this article we will go on to better understand the basics of technical analysis. Later, we will be ready to study each of its components in more detail thanks to the rich content on this portal.
Starting from the beginning, we need to compare the two types of analysis and understand their relative purposes… let’s get started!
Index
Technical analysis vs. Fundamental analysis: what's the difference?
As we mentioned earlier, technical analysis consists of the study of charts.
Indispensable in short-term strategies , this type of research allows us to identify the trend of an asset, the phase it is in and, albeit without any guarantees, predict its future. We repeat, without any guarantee: the approach taken is scientific but there can be no certainty about what will happen. Infallible technical analysis would require a crystal ball. We are trying to equip ourselves but, at least for now, without success.
Fundamental analysis, on the other hand, is suitable for long-term investing. It reasons not about prices and indicators but about the intrinsic value of the asset, who is behind it, what are the plans for the future, and so on.
Let’s take an example by imagining the shares of company XYZ.
In technical analysis we go to view the chart, identify the trend, consult the price and volume history. In this way we will be able to assess whether the trade we had in mind is valid, or we can set up an ad hoc one.
For example, is the trend downward and should it continue? Then we will opt for short positions, so we can sell the asset short and buy it at a lower price later.
In fundamental analysis we will ignore the chart and study the company itself: plans for the future, arrival of new products, sales volumes over time, health of the balance sheet, and so on. We will be able to see if XYZ is viable so that we can possibly invest in it for the future (3, 4, 5 years or even beyond 10).
Therefore, technical and fundamental analysis share only the word “analysis”: otherwise there is really a lot of difference.
However, they can be combined to provide a complete overview; let’s see how.
The company XYZ is solid with excellent plans for the future. Right now, however, technical analysis shows that the trend is downward. We can therefore postpone the purchase of the stock so as to get a better price. In any case, this last point is not a must: if the fundamentals are good they will remain so regardless of the current value of the asset.
A final small “detail”: it is not uncommon for technical analysis to conflict with fundamental analysis. An example is what was written two lines above: good fundamental analysis (therefore future growth) contrasted with technical analysis (negative trend).
Depending on the strategy we have in mind, we will then have to decide whether to ignore this or use it to our advantage.
"When combined, technical and fundamental analysis can be very useful and complementary tools"
Investment or trading?
A necessary premise on the distinction between investing and trading.
The former has a long life, is based on fundamental analysis, and can lead to gains over time.
An investment is like a newly planted tree: it takes a lot of patience and care before you can reap the benefits. At the same time, however, once it has grown, the tree will be solid, have deep roots and be long-lasting.
Trading is based on technical analysis and aims for speculative gains. Potentially, trading also runs out in a matter of minutes.
Here we are dealing with a seasonal seedling: it grows frantically and its gifts sprout quickly. Once its task is done, it dies out.
Investment means believing in a project and becoming part of it. Trading, on the other hand, means ignoring the intrinsic value of the asset and aiming for quick gains.
Neither is better than the other-it depends on the strategies we want to follow.
"Investing and trading are two completely different realities and should not be confused"
Technical analysis: the basic elements
Now that we have our ideas a little clearer, we can delve into the study. Let us be prepared: it is not just a matter of taking a quick look at crypto charts.
Technical analysis has three basic elements: trend, price discounts everything and history. Let’s see what these are.
The trend represents the market trend and is never random: whether it is up, down or sideways, there is always a definite direction.
This point is extremely important. In fact, identifying the trend allows us to ride it and benefit from it: is the stock going up? Will it continue? If yes, we buy. Is the bullish phase at an end? we sell and get the fruits of our hard work.
As for “price discounts everything, ” in technical analysis it is believed that price is the mirror of the whole of all other information. Indeed, changes in it represent the sum of a variety of very different events.
Some practitioners take the concept to the extreme, going so far as to call fundamental analysis almost useless since, as we said, price already says all that is needed. Of course, this statement is not always true, and often one must combine the two analyses to get the full picture.
Finally, the last fundamental point is history, or rather, its repetition over time. That’s right, the famous saying “history repeats itself” also applies in the economic and financial world.
Consulting past trends, prices, market reactions and sentiments helps us predict what will happen in the future. It is amazing how sometimes situations in the past go almost the same way in the present. A good analyst can take advantage of this and play ahead.
We must add one more pillar, which varies from person to person: experience.
Without a background on our shoulders, even knowing every pattern and vocabulary we will not succeed in the effort to produce reliable technical analysis. A lot of groundwork, including mistakes, will need to be done before we can trust our research.
So far we have used a few technicalities, without abusing them. Now, however, it is time to list and discover the meaning of technical analysis terms.
"Trend, price discounts everything and history are the pillars of technical analysis"
Basic terminology of technical analysis
Pattern, bullish, bearish, shadow…how confusing!
To become good analysts, it is essential to know the terminology of the field. So let’s get our heads together and learn the vocabulary essential in technical analysis.
First of all, the market always has a pattern of ups and downs, characterized by classic peaks similar to a mountain landscape. The overview lets us know whether we are pointing up or down.
The trend is the price movement of a particular asset.
It can be bullish(uptrend or bullish) when going up, bearish(downtrend or bearish) when going down, or sideways when staying in a neutral range.
Typical movements in a bullish trend are characterized by higher highs and higher lows.
The former, are higher highs than previous highs. The latter, on the other hand, are lower lows that are also higher than those of the past phase.
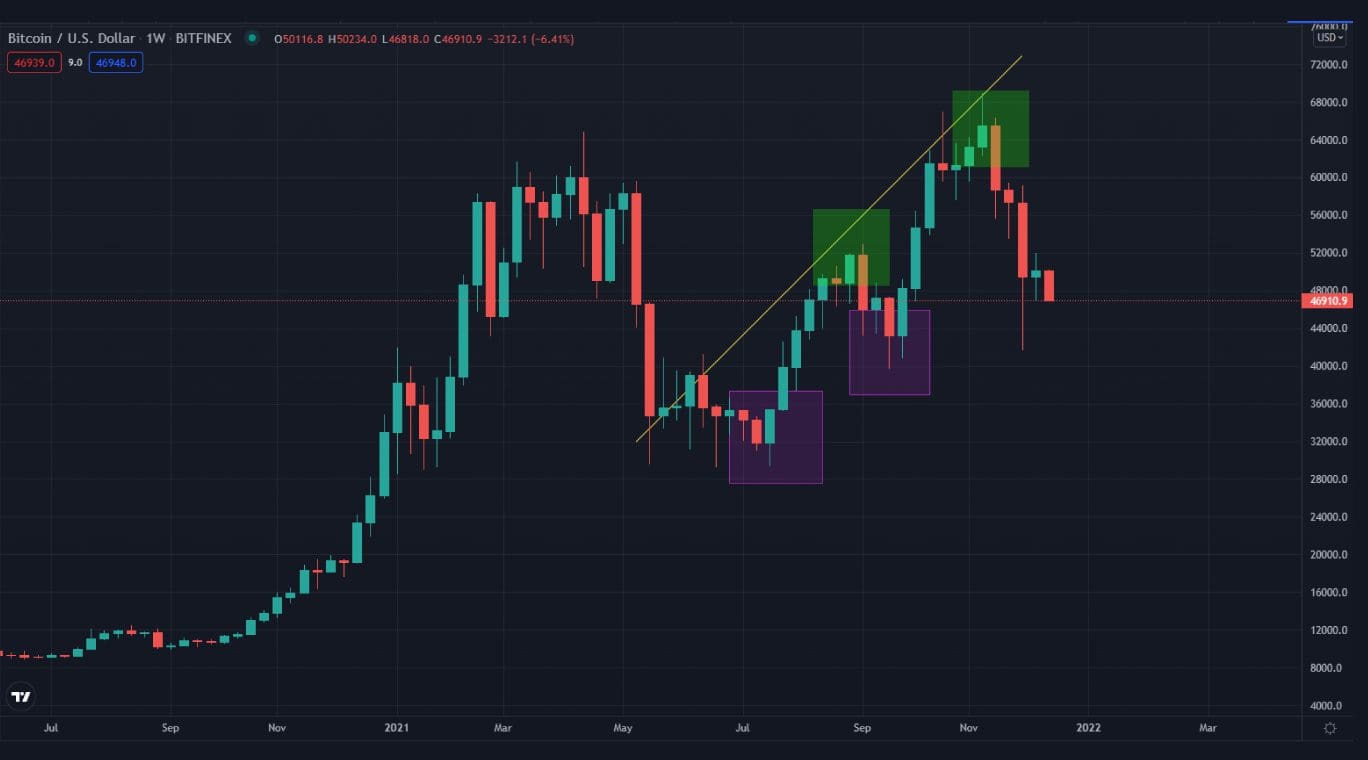
In the image below we can identify what has been said so far:
- An uptrend, indicated by the yellow line;
- The presence of higher highs, highlighted by the green boxes. We can clearly see how the rightmost one is higher than the other;
- The higher lows, delimited by the purple squares. The low positioned on the left is of lower value than the other.

In this screenshot there are all the signs of a good ongoing trend.
However, the last chunk of the chart shows a rather marked descent. Another one is present, around the month of May. These countertrend movements are called retracements. They are essential in a healthy market. However, if pushed beyond certain fundamental levels, retracements can signal the reversal of a trend and the start of a new phase.
The chart just seen shows different chart signs than usual: many expect the classic line, here instead we find green and red rectangles.
Let us then get acquainted with candlesticks.

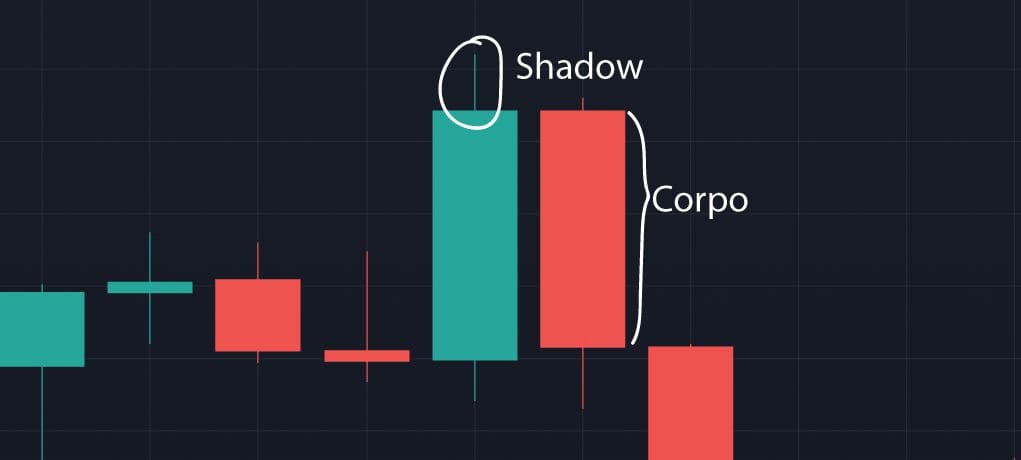
Each rectangle corresponds to a candle and gives us different information: opening price, closing price, high and low touched.
The candle has a body (also called body, see image) and shadows. The body lets us know whether the price went up (green) or down (red). The shadows, on the other hand, reveal highs and lows reached: the upper one (upper shadow) for the former, the lower one (lower shadow) for the latter.
In green candles, the lower side of the body represents the starting price; the upper side is the closing price. In red candles it is the other way around: top end for opening, bottom end for closing.
Each candlestick represents a specific time period, and we have the choice: there are 1-minute candles, as well as daily, weekly, and yearly candles.
Finally, this type of chart also gives us an idea of the volumes traded: the longer the candle, the greater the equity participation will have been.
A few lines ago we mentioned “fundamental levels”: these are resistance and support.
Resistance is a price level that acts as an obstacle to the rise. Support, on the other hand, is a block to a downward movement.
Why are they so important? Simple: more advanced trades and automated order execution by many investors are concentrated around these levels.
Breaking through resistance (breakout) is a strong bullish signal and can quite a bit affect general sentiment. Of course, the reverse is also true: a support that gives way (breakdown) especially one that has been historical and firm for some time is never a good thing.

At point 1 resistance can be seen. The trend waits for a few candles and then pierces it firmly and projects upward. In this case, the resistance changes and becomes support.
Point 2 shows the new support holding up to a retracement, accomplishing a retest. The market reacts well and the bullish structure (higher high and higher low) continues. Later, support gives way (3).
Candlestick length suggests massive selling until it rebounds to another support, 4, which is more solid and also proven in the past.
The trend then becomes sideways, also called a cluster.
Breakouts and breakdowns can also be false and fool us: in some cases, price breaks through a key level and then immediately retraces its steps.
If in the meantime we had fallen into the trap (Bull trap if false breakout, Bear trap if false breakdown) and opened positions, we would face losses.
Therefore, it is always better to wait for the retest, that is, for the price to return to test the previous level. As in the chart, where the price trend punctures point 1, returns to point 2, holds and restarts. Only after the retest could we position ourselves more confidently. The market is efficient and this testing mechanism is a constant never to be ignored!
It only remains to mention two widely used terms: pump and dump.
The former is what we love most: price pushes up hard and you get super gains. The dump is unfortunately the opposite.
Be careful though: after memorable pumps there is always a strong down phase, so never buy an asset if it has already made a full-bodied bull run.
In addition, one must also be alert to the pump&dump phenomenon, which is very common in the world of cryptocurrencies, especially those with higher volatility.
In this case, an epic climb is followed by a very rapid price collapse, due to profittaking(take profit) by investors who have positioned themselves early.
This basic terminology will be most useful as we go about discovering the various types of trades, especially from a trading perspective.
Crypto technical analysis
When said so far is applicable to any type of asset: stocks, bonds, cryptocurrencies…where there is a price trend there can be technical analysis.
In the crypto world , this tool is definitely useful for traders, that is, those who wish to trade on the short term by taking advantage of price fluctuations to make good gains. Of course, the opposite can also happen.
Investors on longer time horizons, on the other hand, should be concerned about carrying out good fundamental analysis. Indeed, a good project remains a good project even if it is in a downtrend.
When we have then identified a coin or token to bet on, we may get good indications from technical analysis. If the price is too pumped up we will wait to buy; or we will maneuver down in case of “sales.”
"Technical analysis of a cryptocurrency is indispensable for the trader but also useful for the investor"
Technical analysis: great but not infallible tool
We have seen how technical analysis applies to everyone, regardless of the type of operation. Moreover, we have dwelt on the added value we get from combining it with fundamental analysis. However, let us come to some final “sore points,” already mentioned throughout the article.
First of all, good technical analysis requires experience: it is unthinkable to be able to be good right away, there are so many variables that you need to know and master.
Technical analysis also requires time and continuous revision. What is valid today may no longer make sense tomorrow.
Finally, reliability. Technical analysis is anything but an exact science.
Think about the complexity of the market: too many variables to be certain that the results obtained actually represent the future. It is precisely on this point that the key reflection must be made. Technical analysis must be done only to take a snapshot of the present. In this way, we will be able to outline the most likely trend ahead, bringing statistics on our side.
Now ideas are clearer and we can confidently continue on our path of growth and study. Patience and perseverance will surely bring us excellent results.