Leggi questo articolo in Italiano

Trade Balance, import ed export
By Gabriele Brambilla
The trade balance shows the trends in a country's imports and exports, with important consequences for the whole economy

Introduction to trade balance
In the jungle of fundamental economic concepts, the trade balance occupies one of the privileged positions. Thanks to it, we can get an immediate view of a country’s health in international trade and thus of the economy in general.
Today let’s get out of crypto territory, leaving bitcoin and companions quiet. Let’s understand what the trade balance is, how it is calculated, and what the scenarios are in case of a deficit or surplus.
Index
Trade Balance: what is it
The trade balance is the difference between a country’s exports and imports in a given period. It is also called net exports, usually represented by textbooks as NX.
The figure shows how a country performed in the international arena during a given period. If imports exceed exports, the situation is trade deficit and on paper negative. Conversely, a trade surplus can indicate robustness and good economic growth.
Important to keep in mind that this figure is lagged and illustrates what has already happened in a specific time frame. In addition, it can be affected by a multitude of factors such as exchange rates between currencies, taxes, trade policies between states, possible wars or sanctions, transportation costs, raw materials, and much more.
How is the trade balance calculated?
The calculation, as we have said, is very simple. Just take the country’s export figure and subtract the import figure.
NX = X – M (where X= exports and M= imports).
Some states take into account both goods and services, while others exclude the latter (calculating them separately) and consider only goods. Therefore, depending on the country we want to consider, let’s inquire which items fall under the data we are going to analyze.
The calculation just seen is the total one , which involves all exports and imports. However, it is also possible to evaluate just the ratio between two countries, so as to examine their position relative to one another. For example, the Italy and US trade balance would require evaluating imports and exports between these two states only.
In addition, it is possible to go even deeper and evaluate specific commodity sectors. We could then analyze data on imports/exports of wheat, spirits, textiles and even soaps and hygiene products. There is no limit: just have the numbers available.
"Formula for calculating the trade balance: NX = X - M"
Negative and positive Trade Balance
Let’s get to the heart of the matter and understand why this data is so important for a country’s economy. We will have a chance to showcase the common thread that connects the various macroeconomic data and indicators.
Exports are goods and services produced in a given state. They are products that leave national borders and end up abroad. Imports are the exact opposite.
Each country has its own strengths that are in demand abroad. Italy has a lot to offer, from food to industrial production, from footwear to motorcycles. However, there are also many goods and services that we do not have, or for which domestic production cannot meet demand; as a result, we must compulsorily import them.
If a state exports more than it imports, the trade balance is positive. Taking the formula again, we will have NX > 0. On the other hand, if a country imports more than it exports, the trade balance will be in negative territory, with NX < 0.
As we saw in the article on Gross Domestic Product, NX is part of the formula for calculating GDP. Consequently, a positive trade balance will help to increase GDP, while a negative one will go to decrease it .
But then, what happens if a country’s trade balance is in deficit? What about when the trade balance is positive? In truth, nothing of concern.
Clearly, from governments to central banks, everyone keeps a close eye on this parameter and wants it to have a “+” sign in front of it, or at least that the deficit is not extreme. After all, the trade balance is considered one of the values that indicate economic well-being and, why not, power.
However, one should not exaggerate and assign too much importance to the trade balance. Or at least, it should not be read alone, but analyzed by taking into account other economic parameters, country conditions, trends over time, and so on. Just to understand, we could have a state with a positive but stagnant balance, as well as one with a negative balance, but economically in very good shape. In this case, the second option would certainly be the best.
"The trade balance is a key figure, but it should not be read alone"
Geopolitics and international trade
Times have changed. While it is before our eyes that actual wars are still being fought, there are other conflicts that do not involve the use of weapons. These practices were well known in ancient times (and they worked), but globalization has made them even more effective.
We are talking about trade wars, sanctions and all other practices that can be assimilated to a very clear objective: to put the opponent in trouble on the economic front.
Think of the U.S.-China clash, which prompted the Trump administration to set a 25 percent tariff on a range of Chinese products, to which others have been added over time. Well, given the characteristics of the States (an economy based on consumption and thus on demand), hindering imports from the world’s largest producer (China) sounds at least strange. Yet, geopolitical considerations have taken over and imposed trade rules that are at odds with the basis of the country’s economic thinking.
There are also other situations, such as sanctions. Russia is the example, reaching an escalation of trade retaliation among the countries involved.
The trade balance is clearly very sensitive to these scenarios and can show quite significant variations depending on the policies adopted.
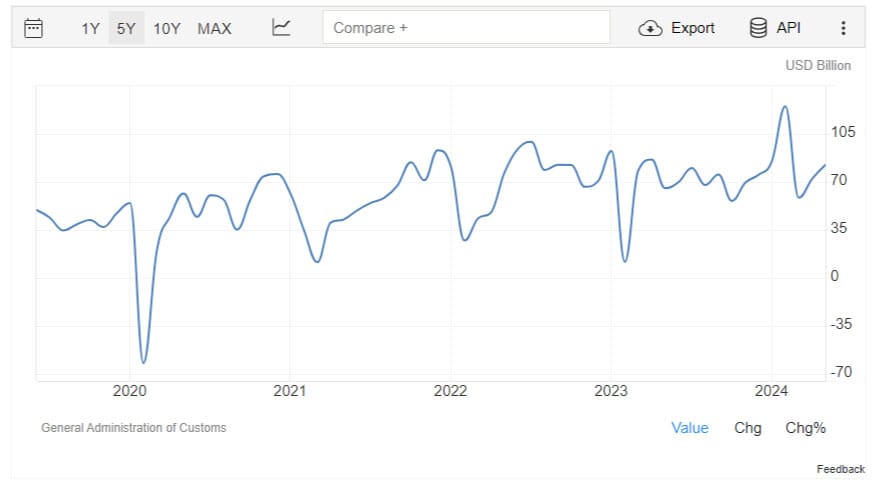
Events beyond our control also have a bearing, as shown by the pandemic. COVID was able to push China’s trade balance, which had always been positive, into negative territory in February 2020. Just one month, of course, but still significant (see below the chart from Trading Economics).
In short, the balance goes far beyond a simple calculation and houses a vast and complex world.
You should now know all that is important about the trade balance. Keep following us for more in-depth articles from the world of macroeconomics.
