What is a Trading Journal used for?
Very good dear trader, welcome to this new article on advanced trading. Today we are not going to analyse price movements or particular strategies, instead we are going to focus on the skeleton that allows our trading to sustain and evolve along with our strategies.
The main reason why we start writing and constantly update our crypto trading journal, is that it allows us to work and have an immediate insight into the numerical data resulting from our trading:
- Starting with the basics, we will have a clear view of whether our strategy is profitable or not
- If we use several strategies, we will have a TJ dedicated to each one, having them well separated and analysable individually
- In each of our strategies, we will have a comprehensive list of every trade and operation executed
- All this information will be chronologically ordered, so as to show us the evolution of our operations.
Index
Why is the Trading Journal important?
The most important documentation that you will be able to draw up in your trading activities is certainly the monitoring of your trades: during demo trades, backtests and strategy implementation.
By the time the trading plan is well structured, however, you will need to monitor the performance of the individual components.
By transcribing and jotting down every step you take in the trading world, you will have every victory and every mistake at your fingertips, you will be able to take note of improvements and what is still hurting your results.
Compiling the trading journal will help us every step of the way:
- It will help us optimise our strategy in the backtest phase;
- Once we have a complete checklist, it will help in noticing changes in our market advantage;
- When we feel that our strategy is no longer working properly, it is thanks to the trading journal that we will be able to find the solution to become profitable again
Trading Journal software with Notion
We have realised, therefore, that in addition to constancy in the drafting of our Trading Journal, we need a graphical schematisation of each trade, which ultimately allows us to have the recurring parameters of our trades clearly highlighted.
So here is the question we are all asking ourselves, how to create a trading journal?
Notion is a software related to productivity and to the management of tasks and information, used by many work teams of large companies such as Spotify and Nike, it allows both to take notes like a normal text software, and to customise these text notes: to-do-lists, tables and portfolios, everything we may need, the only flaw, if some Notion expert can disprove us we will be happy to take the skill, line graphs, pie charts or histograms cannot be implemented. The use of Excel instead of this software is for this reason recommended, but today we wanted to bring you something different.
The possibility of having personal or group pages also makes it very useful for team work and for sharing ideas in a working group.
The feature we are interested in is the table layout:
- Introduces intuitive and specific column categorisation
- Allows the calculation of numerical elements in each column
- Introduces a method of dividing tables by subcategories
Let us now see, step by step , how to structure a basic TJ model. In the following, we will list the main elements for extrapolating data, which are functional for understanding our strategy.
Each of you, from the experience you will gain in editing this very important paper, can and must insert the elements most congenial to your operating method, characterising and constructing it to measure.
From the colours of the columns, to the layout subdivided by emoticons, Notion is truly infinitely customisable, and you will discover by using it how useful it can also be for personal notes related to your productivity, but let’s not waste time on these pleasures and concentrate on the work.
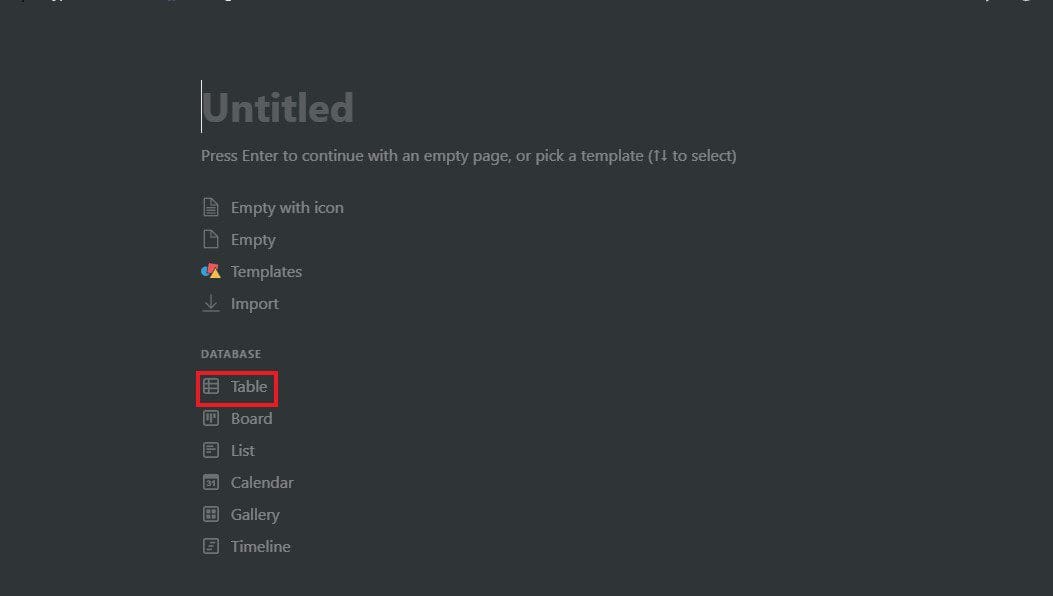
After creating the first page, the software gives us the possibility to set up several predefined layouts, the one we are interested in is ‘Table’ which will give us the possibility to have our table pre-set and ready to be modified as we like.
Let us therefore see below how to structure a table containing the essential elements.
Data of the trade
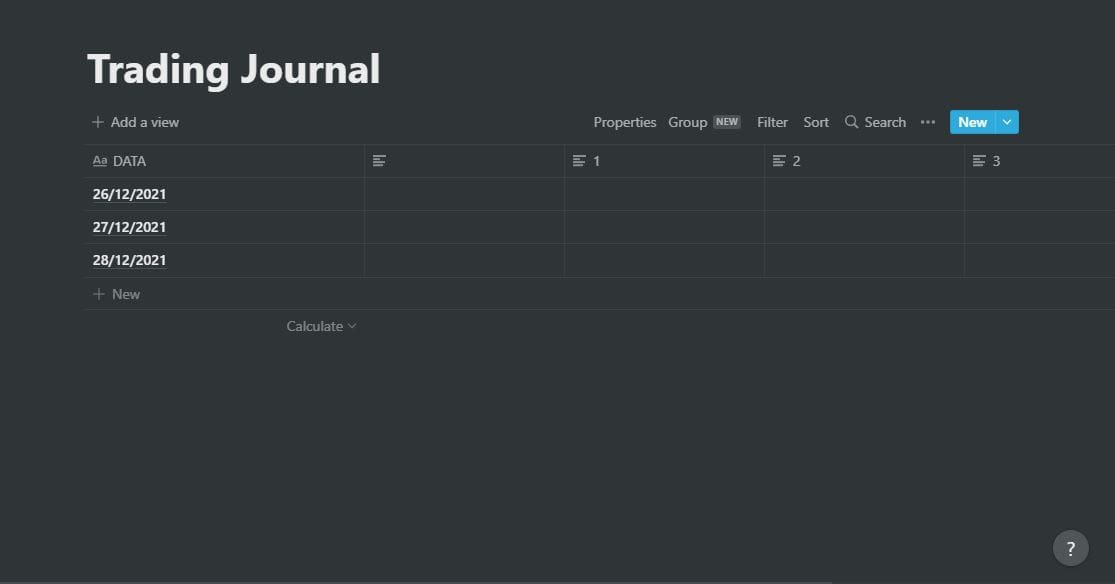
The positioning of a trade over time, provides chronological order to the diary and allows us to divide up the trading year according to our needs, revision or rebalancing.
The first column is usually not editable but remains a fixed text element, I therefore advise against entering numerical elements in this field from which we need to extrapolate calculation results, as on text columns, these will not work.
Operating Session and Time
This element may seem futile in a 24/7 open market, but let us remember that we are still the little brothers of the regulated markets.
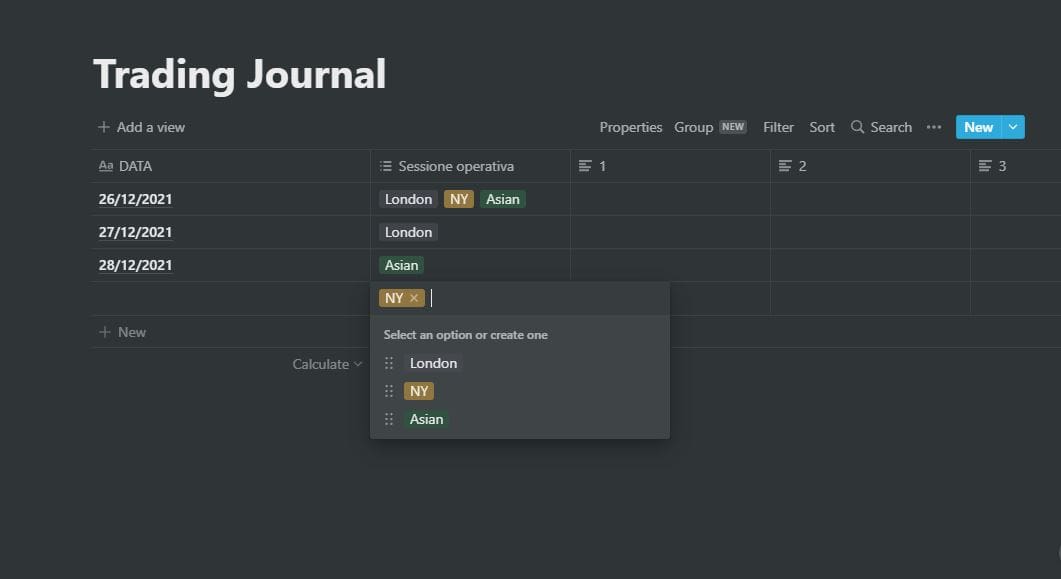
The big money often comes from there and respects the session times (London, NY, Sydney and Tokyo), so it will not be difficult to notice an increase in volatility at the openings .
This is something that can greatly help those who are still developing their statistical EDGE to narrow down their operating sessions, eliminating the paradigm that the more you chart the more you make and concentrating, instead, on what matters in discretionary trading: optimising your strategy.
On a large operational database, having marked the sessions, it will be clear to us which ones fit best with our strategy, so at which times we should focus our activity.
Assets
Each asset we trade on should have its own trade list, as each one has its own characteristics, which make it unique, and to which our strategy should be adapted.
If, on the other hand, we work with divided portfolio sections (Holding, maxCap trade, Speculative-Lowcap trade, Defi strategy multichain) then we will structure different tables with parameters customised to each type of trade or investment.
Today we will focus on monitoring a checklist strategy that, depending on certain market conditions, allows continuous and predictable trading on a predefined group of assets (1 to as many as the strategy supports).
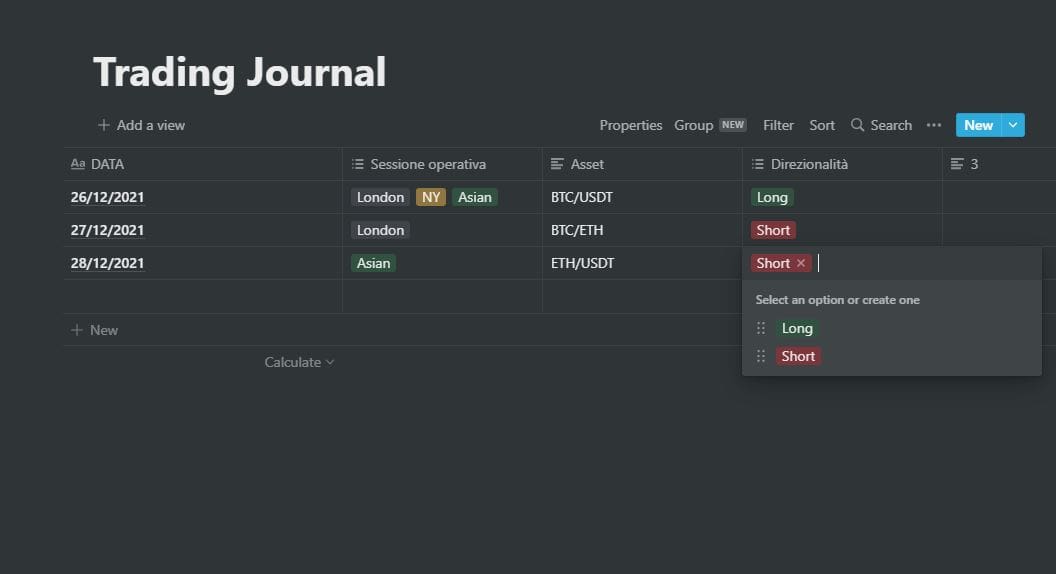
Directionality
The easy summary of preferred directionality, can be useful in identifying emotional bias, making it visible if in periods of negativity or low confidence we have preferred a Short trade and perhaps in moments of euphoria we have only opened Long.
It also depends a great deal on the type of strategy: if we are looking for market lows to execute bullish swings, it is clear that the directionality will often be Long, vice versa if we are looking for bearish reversals due to loss of momentum we will tend to have Short operations;
In a balanced strategy, on the other hand, on large numbers the ratio of longs to shorts should be balanced.
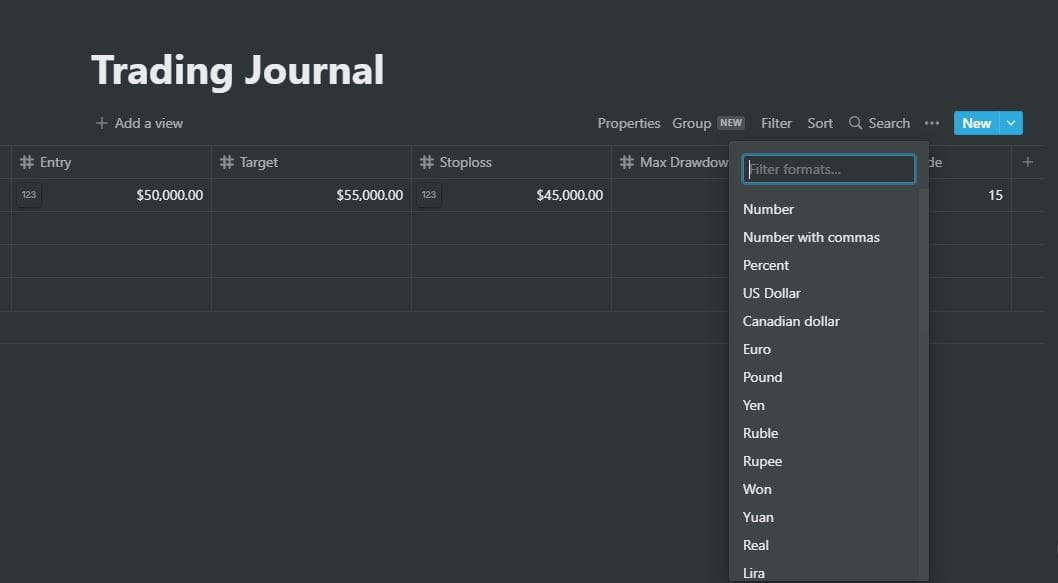
Entry and exit price
Important in order to have an a posteriori view of the various levels at which the asset was traded.
When writing this data, you can add endless variations and details related to the percentage of growth, the maximum drawdown endured, the number of days taken by trade to go to target/stop;
In short, this is where your critical data analyst spirit will have to step in to help you identify what data might be useful to have at hand, for strategy optimisation.
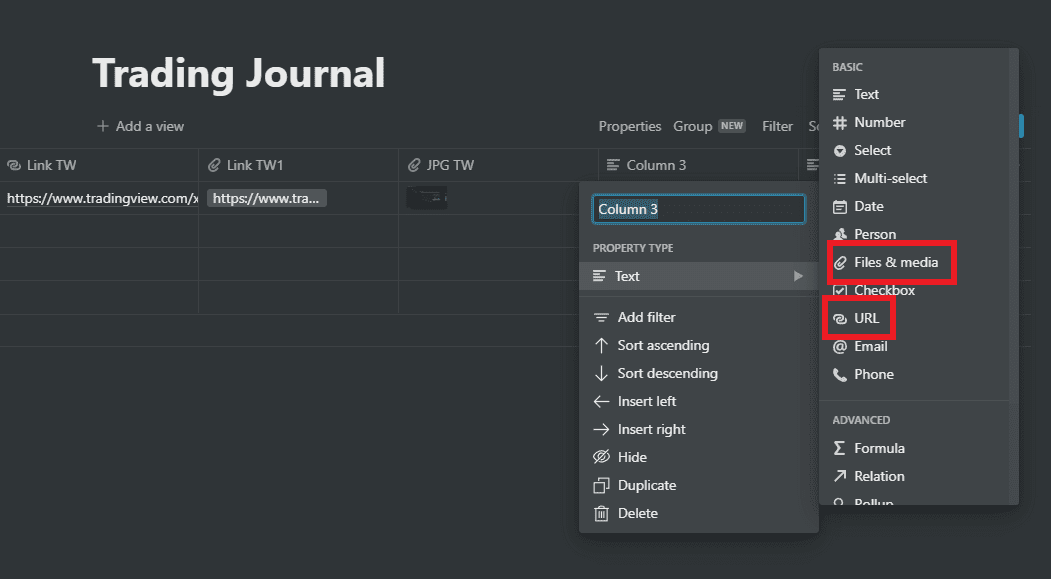
Link trade on Trading View
Essential to get an immediate view of the conditions under which the trade was made.
The chart analysis should be clean and understandable, but of course being personal one can manage one’s own analysis as one sees fit.
To take the screenshot of the chart from TradingView, simply go to the camera icon at the top right and select one of the fields to export the link or image.
The screenshot of the trade is also important to keep an eye on which patterns work and which don’t, which ones lead to major price excursions and which ones are a trap for retail stops.
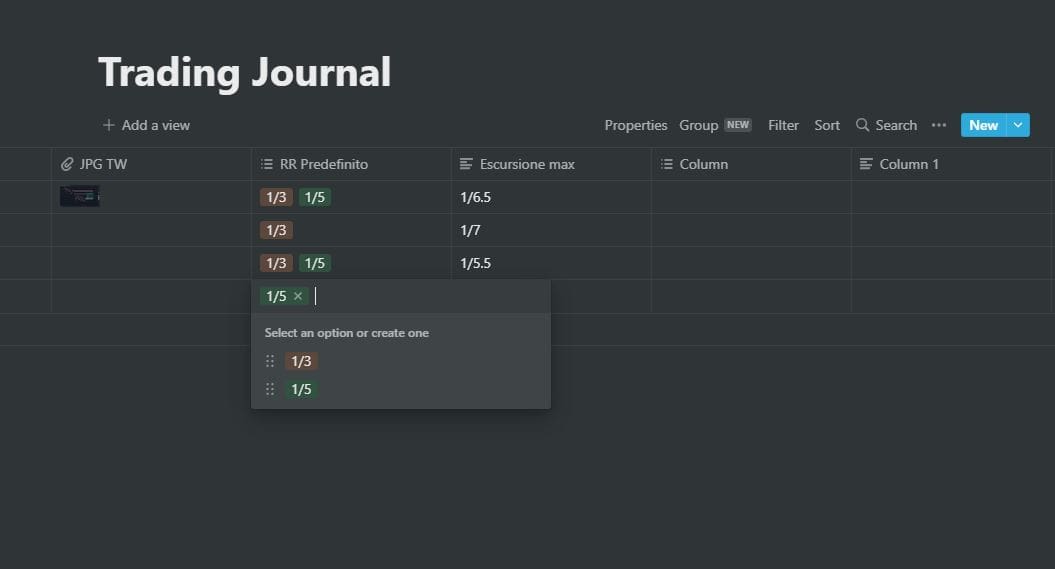
Planned RR
We have said that this value must be predetermined, if the actual RRs correspond to those planned it means that the strategy is being followed correctly, while if the actual RRs are less or greater than those planned, perhaps from an emotional point of view (fear and greed) some improvement could be applied
- Lower RRs than planned correspond to premature exits due to fear or operational mismanagement.
- Higher RRs indicate either a tendency to go into greed, i.e. greed towards a directional market, or one could revise the predefined RR. so as to intercept larger movements that the market actually offers.
Having an immediate view of what the average RR values are, helps to optimise the default RR.
You can also mark additional price movements compared to the RR reached
Operation Management
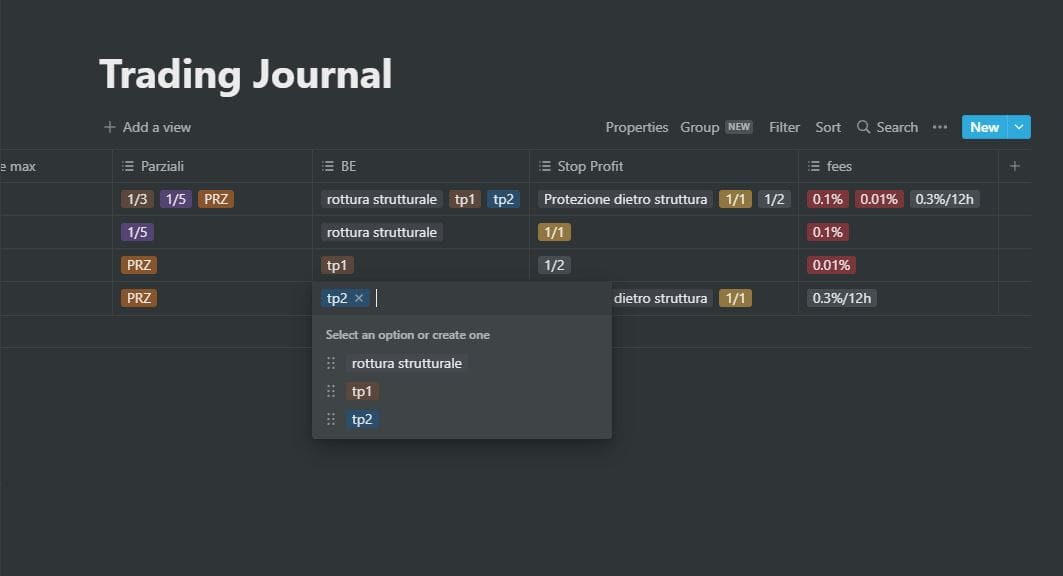
The management of the trade, from the point of view of follow up once it has entered the market, is what often makes strategies profitable.
The elements that make up operational management are diverse and characteristic of each individual’s strategy, so take the time to identify effective or penalising management patterns.
Checklist points
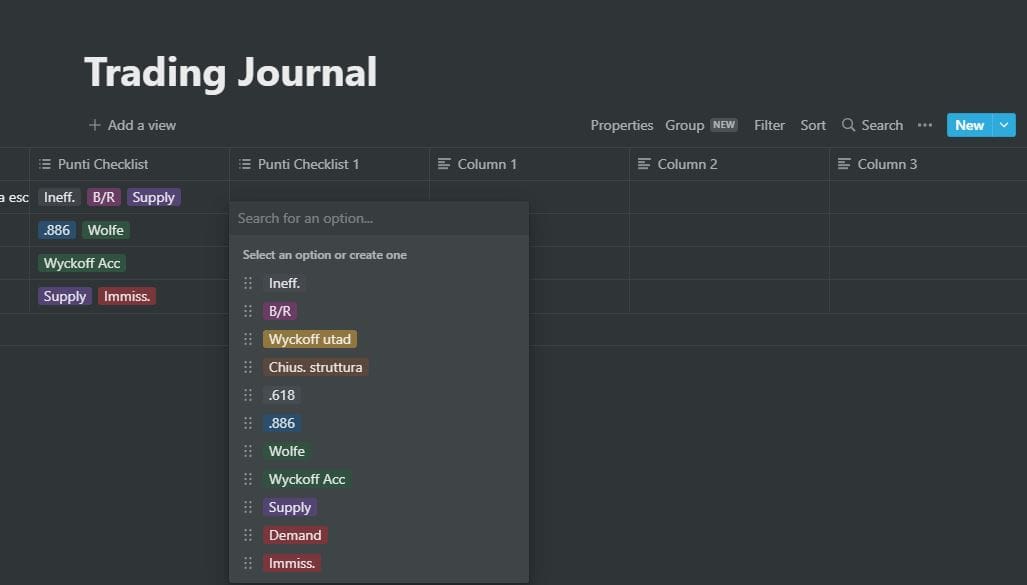
Which ones? How many? Out of a base of 100 trades, which ones worked best and which ones led to defeat? This is a crucial element in the backtest phase, it allows us to have data on the effectiveness of our checklist.
Also in the monitoring phase, it will allow us to highlight which elements, due to variations in market dynamics, work best in certain time periods and how our checklist changes, depending on these variations.
Thanks to the Multiselect function, which we have used so far, it will be much easier and visibly immediate to mark and differentiate these elements.
Trade Outcome and Improvement Notes
After detailed planning, we will highlight the final result by finding answers to several questions:
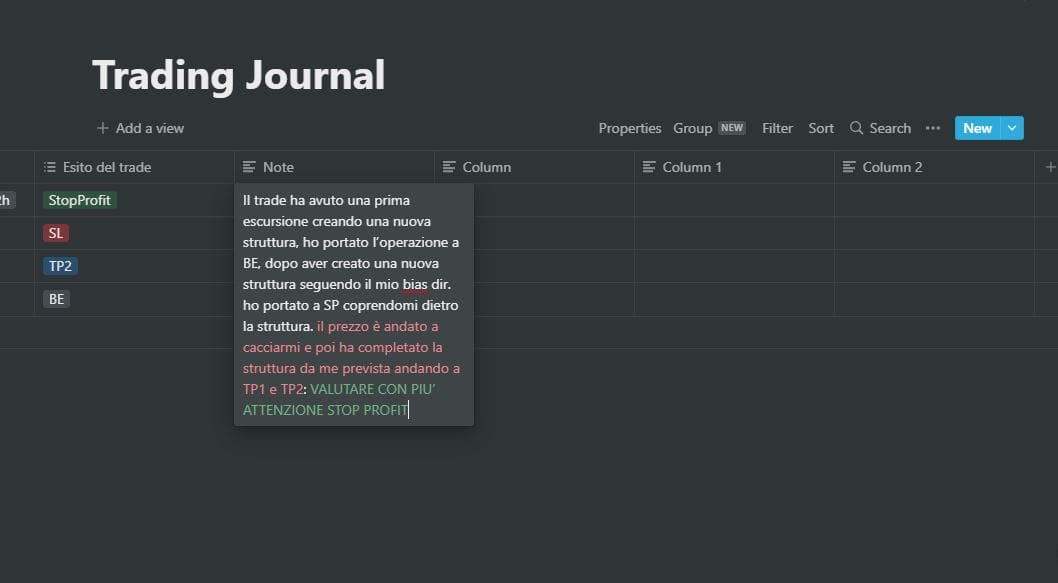
How did the trade actually go? Did it follow our analysis? Did it go to a stop? What % did he get from the take profit before reversing and going to SL?
These are all questions that are usually asked by the trader, who always wants to take his strategy to the next step, and which often make him profitable regardless of changes in market logic.
Because, through the answers to these questions, cumulative for each trade, one can find a statistic as to which operational management optimises results.
It can be structured in the table as a combination of actual RR and Improvement Notes
Conclusions
We have seen together, step by step, how and what elements to lay out in our Trading Journal, I hope it can be a useful starting point from which you can create wealth and value.
Regardless of the trading side, I believe that keeping track of one’s achievements and failures can be a great way to keep track of, if one can call it that, one’s evolution and maturation.
Having said that, I would like to remind you that the software that we have proposed today is purely indicative, everyone should feel free to organise themselves using the tools that they prefer and that are most useful.
Thank you for your attention and see you next time!

