Categorising trading patterns
Identifying patterns within an asset’s chart means identifying repeated patterns of price behaviour.
Through this process, the outcome of market forces can be more accurately delineated. Patterns often result in phases of price declines and ruthless bull-bear struggles.
Classifying patterns and their potential evolution is the main task of technical analysis, so let’s see which ones are the most commonly used and how to distinguish them within market movements.
Patterns are very different, there are many types and today we will mainly analyse two macro-categories:
- Candlestick patterns
- Discretionary chart patterns
Following the price trend and predicting the creation of certain patterns, is a skill similar to hunting: one must be able to identify the tracks left by market forces and follow the wounded animal until a good view gives us the opportunity to execute a precise strike.
The reversal of a trend is almost never an easy or painless operation: the prevailing of one force requires the succumbing of the other, and, rest assured, bears and bulls alike sell their hides dearly.
So let us see what characteristics suggest that we may be close to a reversal situation.
Index
Reversal Pattern
In order to be able to speak of a reversal graphic pattern, certain elements must be present:
- A well-defined trend, which may or may not have characteristics of overextension, depends on several factors related also to the type of asset.
- The size and temporal extension of the figure.
- Unlike continuation formations, which are generally small, reversal formations are large and extended in time; as a general rule, the more extended the formation, the stronger the operational implications.
There is also the different volatility and speed between bullish and bearish reversals to consider, generally the formation of tops is much faster and more volatile than bottoms.
There are not only reversal figures, but also faster contraction figures, which serve to break the impulsiveness of the movement, before its continuation, are called continuation patterns.
Continuation Pattern
Continuation patterns are characterised by slowing of the current trend, usually after a considerable and hardly sustainable impulsiveness.
Characterised by the need for those who are controlling the trend to breathe and give the market a chance to bargain on both sides, they usually do not give the other side too much time before breaking the downtrend.
‘An army that has pushed forward too quickly, that has penetrated far into enemy territory, must eventually stop, retreat a little to an easier position to defend and dig in, propose replacements and establish a strong base from which it can later launch a new attack.’
(Edwards & Magee)
As we saw in the previous paragraph, if what we thought was a continuation figure does not react in an impulsive manner but lingers in uncertainty, the doubt that it is in fact a reversal figure should be felt, as continuation patterns tend to have a short duration.
Having defined the main categories into which the graphic patterns are divided, let us now look at their main conformations.
Triangle pattern trading
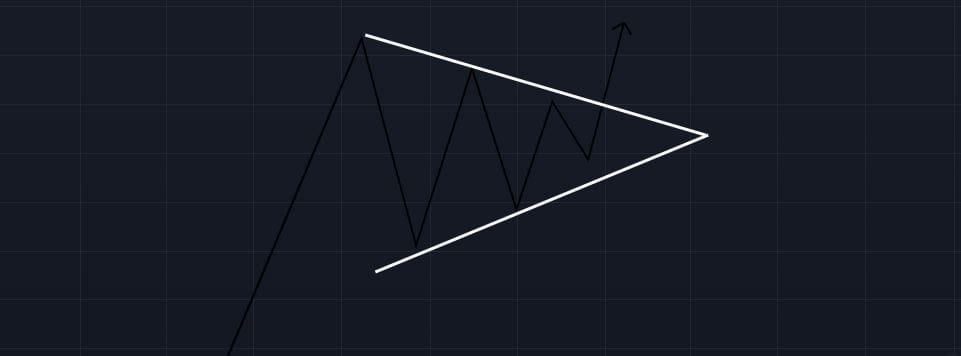
Triangles are trend congestion formations ; characteristic of this figure are the lows and highs that converge towards the same point, forming our triangular figure.
The battle between buyers and sellers is not regular and can take different forms depending on the situation and the forces at play.
There is no doubt that sooner or later a triangle break-up will occur, however triangles are both reversal and continuation formations, so it is advisable to wait for price to break out of the figure before identifying it in one or the other category.
A fundamental requirement for evaluating triangles, as we have said, is the point at which the figure breaks, which, to be reliable, must necessarily occur between half and three quarters of the way through. The directionality of the break-up, if accompanied by sustained volumes, helps to predict the subsequent movement.
It often happens that once the directional break has been executed, the market returns slowly to test the break level, thus gaining the ‘momentum’ for the continuation of the movement, and it is here that one should wait for the market, to exploit to our advantage the statistics of the triangles.
If, on the other hand, the retest movement occurs with sustained volumes, perhaps following a weak breakout that occurred with low volumes, the signal becomes dangerously similar to a false breakout.
Double Top & Double Bottom
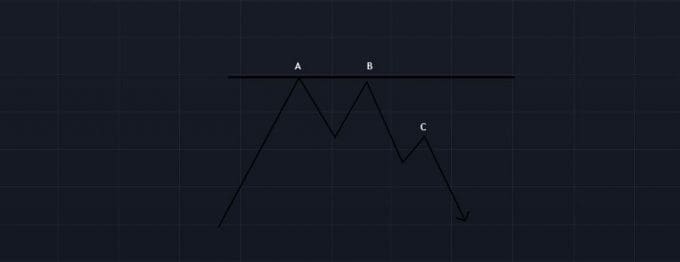
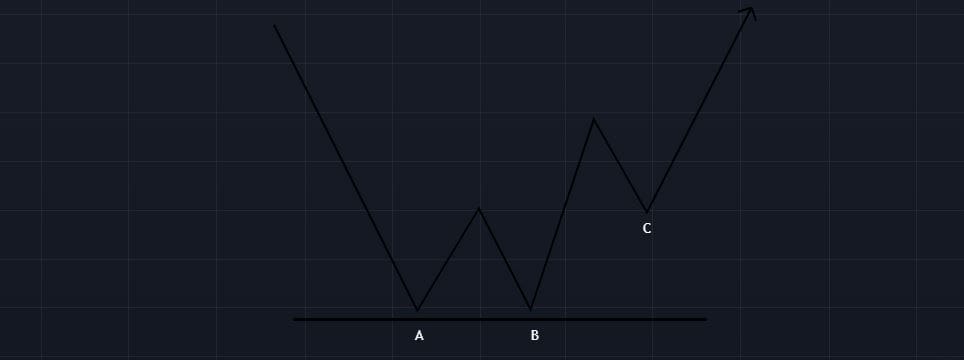
As the name implies, the double top is a pattern with two peaks placed at approximately the same level.
As far as the evolution of the prices that lead to this conformation is concerned, we are most often in the presence of a final, exaggerated phase of a bullish trend (analogous considerations, even if reversed, must be made for the double minimum).
The successive rise (B) fails to restore the initial uptrend, since, as we have just said, it stops in the vicinity of the first maximum, moreover with low volumes.
The reaction that develops, leads prices to a second fall, this time more decisive, which pushes prices beyond the relative minimum, previously formed.
The double minimum has a logic and a conformation entirely similar to that of the double maximum, it differs only in the fact that: the rally that leads to the movement of prices away from the second peak, must be accompanied by robust volumes, present at the time of the break.
The market is full of potential double highs and double lows, but there are few that are interesting operationally and when they occur they act as reliable trend reversal indicators.
Be careful to operate with a tight stop loss as soon as the figure is broken as these patterns are often subject to manipulation and stop hunts being well known in the world of technical analysis.
Flag pattern trading
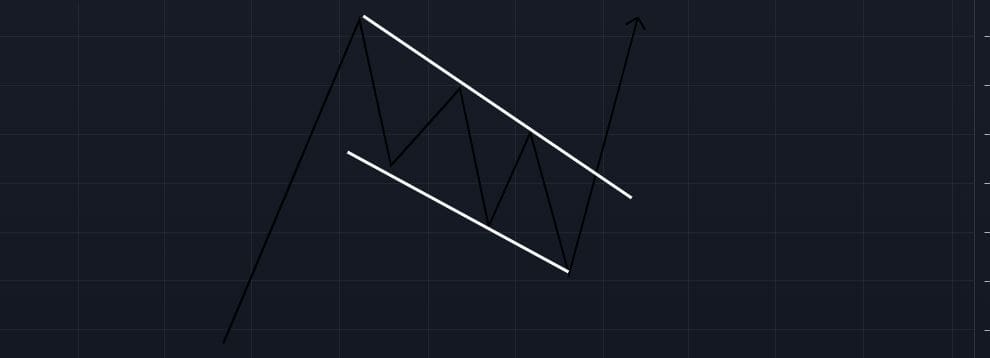
The formation of a flag pattern, begins with a reaction contrary to the trend of origin, classifiable as a physiological pause of consolidation after a prolonged trend.
The prices react recovering a good part of the movement but fail to create a new maximum, they resume a contrary direction to the main movement delineating a sort of channel, a kind of rectangle inclined in the opposite direction to the main one.
Prolonged and exaggerated movements in one direction only increase volatility, and high volatility does not allow prices to continue in the same direction.
What is needed is a sideways or opposite direction movement, capable of disposing of excess volatility and thus allowing the market to restart. This is why we rarely see V-formations, where a rise is promptly followed by a fall, or vice versa.
Rising Wedge pattern trading
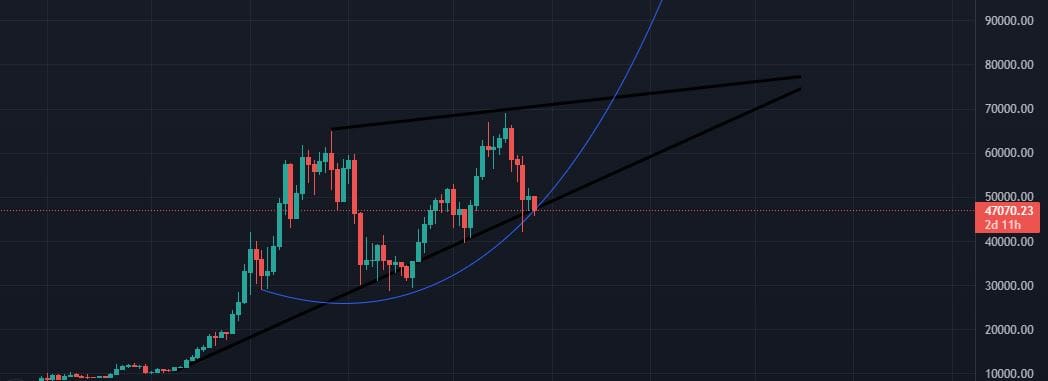
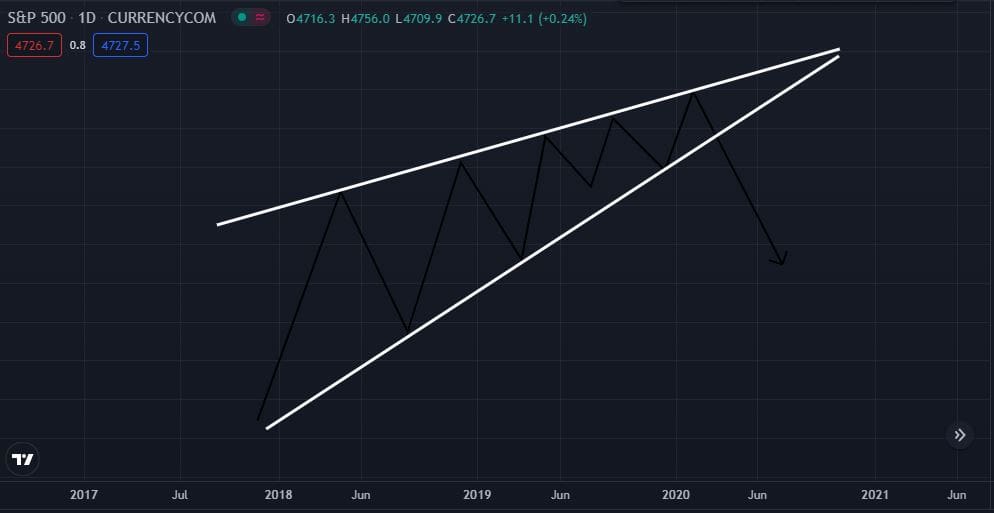
The Rising wedge (inverse of the Falling wedge) is a bearish pattern belonging to the triangle family.
Like the latter, in fact, the rising wedge maintains the same technical characteristics both in terms of volume (which decreases as one approaches the cusp, to then explode at the moment of break-up) and duration (the longer the pattern is formed, the greater the violence and extension of the reaction).
The pattern is composed of two positively inclined trendlines (two bullish trendlines) converging towards an upper apex, unlike more conventional triangles formed by a bearish trendline and a bullish one.
The rising wedge in its ideal (and best performing) conformation occurs at the apex of a bullish trend, in which case it will mark a trend reversal.
The pattern is more difficult to recognise as it does not violate the characteristics of a bullish trend, i.e. the succession of rising highs and rising lows.
Attention must therefore be paid to the fact that the succession of highs has a positive slope, but less than the positive slope of the succession of lows.
Falling Wedge pattern trading
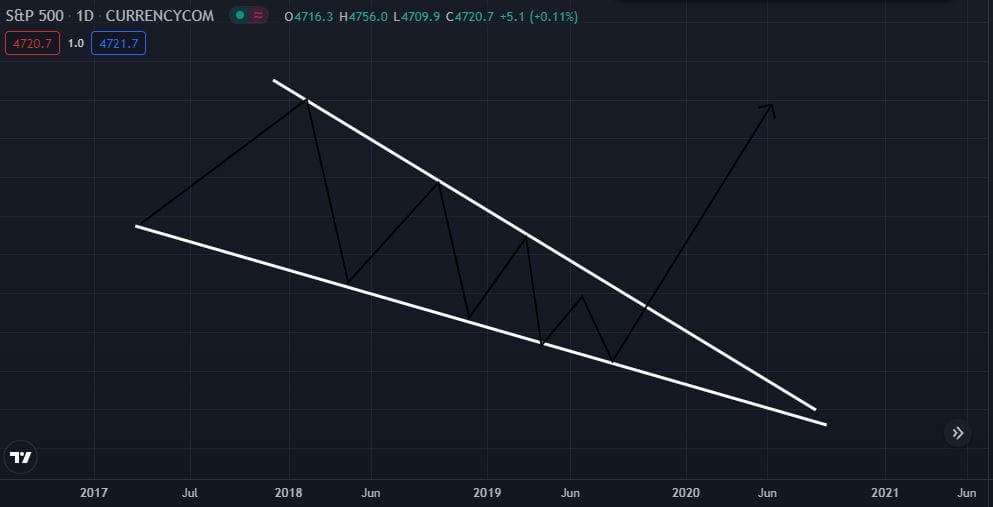
The Falling Wedge is a bullish pattern that can be included in the family of triangles.
Like these last ones, in fact, the falling wedge maintains the same technical characteristics both in terms of volumes (that decrease as one approaches the cusp, to then explode at the moment of the breakup) and of duration (greater is the duration of formation of the pattern, greater will be the violence and the extension of the reaction).
The pattern is composed of two negatively inclined trend lines (two bearish trendlines) converging towards a lower wedge.
The falling wedge in its ideal (and best performing) conformation occurs at the end of a bearish trend, in which case it will mark a trend reversal.
The pattern is more difficult to recognise as it does not violate the characteristics of a bearish trend, i.e. the presence of falling lows and falling highs.
It will be necessary therefore to place attention to the fact that the succession of the minimums presents a negative inclination, but inferior to the negative inclination of the succession of the maximums.
Once delineated graphically the formation it remains only to wait for the breakup, that it will have to have elevated volumes, closings on the maximums and volatility greater of the previous one in order to re-enter in the typology of ‘ideal breakup’.
"Wedge’ in English means wedge while ‘falling’ is the opposite of ‘rising'"
Head & Shoulders
The Head and Shoulders is an articulated reversal figure, as we can see in the image below.
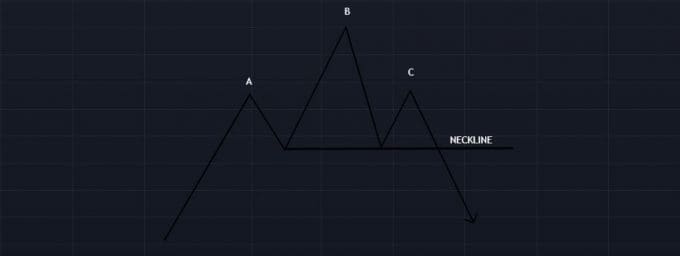
During a regular uptrend (AB) an exhaustion of bullish strength occurs, resulting in the creation of a low lower than A (structural support); this is only a first clue to the possible creation of a Head and Shoulders pattern.
The second clue, which suggests to us the creation of a head and shoulders pattern (top formation), is the creation of a maximum lower than B; this is often a symptom of trend reversal, as the succession of HH and HL is interrupted.
The final clue that allows us to identify this particular graphical figure, is the breaking of the c.d. line of the neckline (Neckline): through this movement often impulsive and supported by strong volumes, the pattern is confirmed going to mark in succession of LH and LL, characteristic of trend bearish.
How to position oneself with respect to this pattern? Often once broken the Neckline, as we have also seen in the triangular figures, the market tends to retest the zone of breakage in order to obtain sufficient momentum for the continuation.
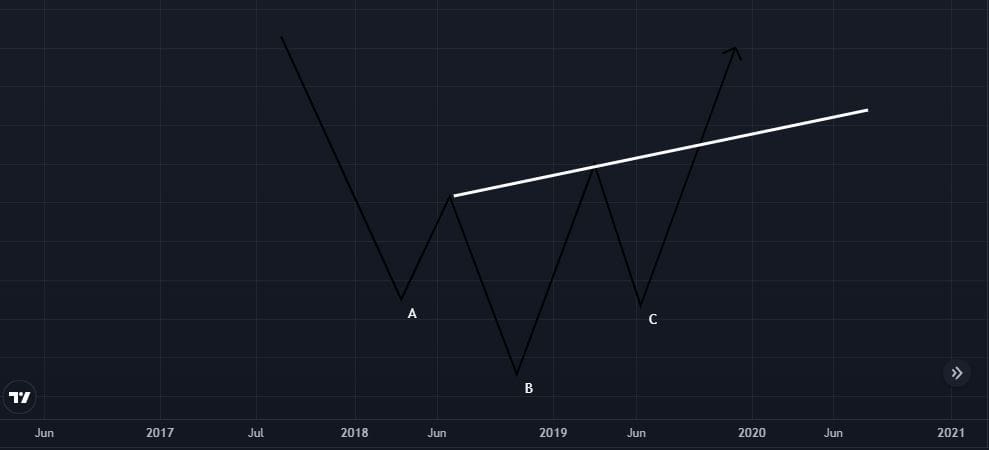
The considerations just made are substantially applicable also to the head and shoulders of bottom, that is to that characteristic figure of the reversals to the rise.
Particular characteristic of the Neckline, in a head and shoulders bottom, is to be inclined towards the high, that is in the same direction of the trend that it preannounces. For the rest, the same considerations made for the head and shoulders of bearish nature apply.
Conclusions
To use the graphic patterns as support to the own analyses, allows to have a clear and ordered vision of the forces in game in the market.
To carry out studies on the graphs of the principal cryptocurrencies, we advise you as always the best software of graphical analysis in circulation: TradingView.
The portal offers a free basic plan sufficient for minimal use. If instead you would like to take advantage of all the tools made available: Lower Time Frame, no limit of indicators per chart, possibility to use the Replay and many other features, I leave you the link to subscribe to TradingView and get a bonus on advanced plans.
In the next article we will instead focus on the main candlestick pattern formations, i.e. those clues left by market participants within individual candles.
Did you know these chart formations? Did you use them in your trading plan?

