TradingView: piattaforma di analisi tecnica e fondamentale
Vero punto di riferimento, TradingView è il portale perfetto per svolgere analisi tecnica e fondamentale su criptovalute, azioni, commodities, futures, indici e forex
Indice
- Introduzione a TradingView
- Che cosa è TradingView?
- A cosa serve TradingView?
- Panoramica sulle funzionalità di TradingView
- Basi di TradingView: grafico e indicatori
- Basi di TradingView: personalizzazione
- Come impostare RSI su TradingView?
- Quanto costa TradingView?
- TradingView: super piattaforma di analisi
Introduzione a TradingView
Ecco un approfondimento interamente dedicato alla miglior piattaforma di analisi tecnica e fondamentale in circolazione: TradingView.
Parliamo spesso di strategie e indicatori, ma come impostarle e consultarli? Qual è lo strumento da impiegare per svolgere un perfetto lavoro di preparazione e monitoraggio degli investimenti? TradinView è la risposta.
La piattaforma non ha bisogno di presentazioni e da sempre è il miglior amica di tantissimi trader e investitori. Grazie all’abbondanza di grafici, materiali, notizie e dati, questo servizio ci permette di essere sempre informati e aggiornati.
L’approfondimento che segue si suddivide in due parti.
Nella prima, esploreremo TradingView in modo generale, scoprendo alcune delle funzionalità più utili.
A seguire, il contenuto sarà dedicato a interfaccia e opzioni, con focus sugli strumenti più comuni.
Infine, spenderemo qualche riga per analizzare i vari piani a disposizione.
Al termine sapremo muoverci con tranquillità in TradingView. Sarà quindi più semplice scovare e sperimentare le (quasi) infinite funzionalità proposte.
Una piccola precisazione prima di entrare in full immersion: questo tool richiede buona conoscenza dei principali concetti di analisi tecnica. In caso contrario, sarebbe impossibile sfruttarne appieno le potenzialità.
Che cosa è TradingView?
TradingView: un nome, una garanzia.
Eccoci a trattare di una delle più apprezzate piattaforme dedicate all’analisi tecnica e fondamentale su svariate categorie di asset. Non solo: il portale presenta anche elementi social che consentono agli utenti di condividere opinioni e strategie.
Quando si presenta un servizio, i numeri sono un biglietto da visita irrinunciabile. Perciò, eccone qualcuno decisamente significativo:
- Miglior sito al mondo dedicato agli investimenti. Giganti come Investing.com e CoinMarketCap guardano dal basso;
- Oltre 30 milioni di visitatori mensili;
- Più di 8 milioni di script e opinioni condivise tra la community.
Oltre ai dati, fa piacere mettere in risalto un aspetto: TradingView è un servizio interamente dedicato all’analisi e non c’è alcun modo di comprare o vendere asset. L’utente non viene spinto a operare e il focus dell’azienda è solo su qualità e completezza delle informazioni, un grande valore aggiunto.
Possiamo essere investitori alle prime armi, trader esperti o semplici curiosi. In qualsiasi caso, questa piattaforma è ciò che fa per noi.
TradingView rende possibile il monitoraggio di numerosi mercati e asset, coprendo pressoché tutte le aree di interesse.
Nello specifico, il portale contiene grafici e informazioni su azioni, futures, indici, forex, criptovalute, bond e parametri economici. Dal prezzo di scambio BTC-USD fino ai dati su inflazione e disoccupazione di un certo Paese, non manca nulla.
Ciascun grafico è personalizzabile a piacimento. L’utente può includere numerosi indicatori, scrivere commenti, preparare strategie semplici o complesse. Inoltre, sono disponibili notizie e parametri di analisi tecnica e fondamentale che concorrono a creare una fotografia davvero completa.
In aggiunta, molti asset dispongono di dati provenienti da più fonti. Ad esempio, l’accoppiamento ETH-USD (Ethereum-dollaro americano) prevede una moltitudine di grafici, ciascuno dei quali basato su un determinato exchange. Potremmo decidere di monitorarne il prezzo su Bybit, Binance o Crypto.com, giusto per citarne alcuni.
Questo aspetto è importante: l’utente può scegliere la fonte basandosi sugli exchange da lui utilizzati.
Data la natura social di TradingView, gli utenti possono condividere strategie e idee con la community. Perciò, oltre a consultare i numeri, abbiamo a disposizione anche dei materiali aggiuntivi sviluppati da altri investitori, utili per ampliare le proprie vedute e confrontarsi.
Riassumendo quanto detto in questa fugace prima occhiata: TradingView è il portale di riferimento per studiare sia i fondamentali che i parametri tecnici di un asset. Grazie agli strumenti proposti, l’investitore può decidere consapevolmente come muoversi e quale strategia mettere in campo.

A cosa serve TradingView?
L’abbondanza di asset, funzionalità e indicatori rende TradingView una piattaforma inizialmente difficile da digerire. Non c’è di che preoccuparsi: superata la prima fase diventa tutto più intuitivo.
Elenchiamo gli asset e i mercati a disposizione.
TradingView propone una vasta scelta in questo senso. É arduo non trovare ciò che ci interessa.
Innanzitutto gli indici. Possiamo consultare grafici e dati provenienti da ogni parte del mondo. Impossibile non citare quelli fondamentali come S&P 500, Dow Jones, Nasdaq, Nikkei 225 e il nostro FTSE MIB.
Non ci si ferma qui. Ad esempio, siamo in grado di esplorare ognuno degli 11 settori che compongono l’indice S&P 500, così da disporre di una fotografia ancor più precisa della situazione.
Troviamo poi gli index relativi alle principali valute. Studiando questi dati ci rendiamo conto dell’andamento di una determinata moneta in modo neutrale e affidabile.
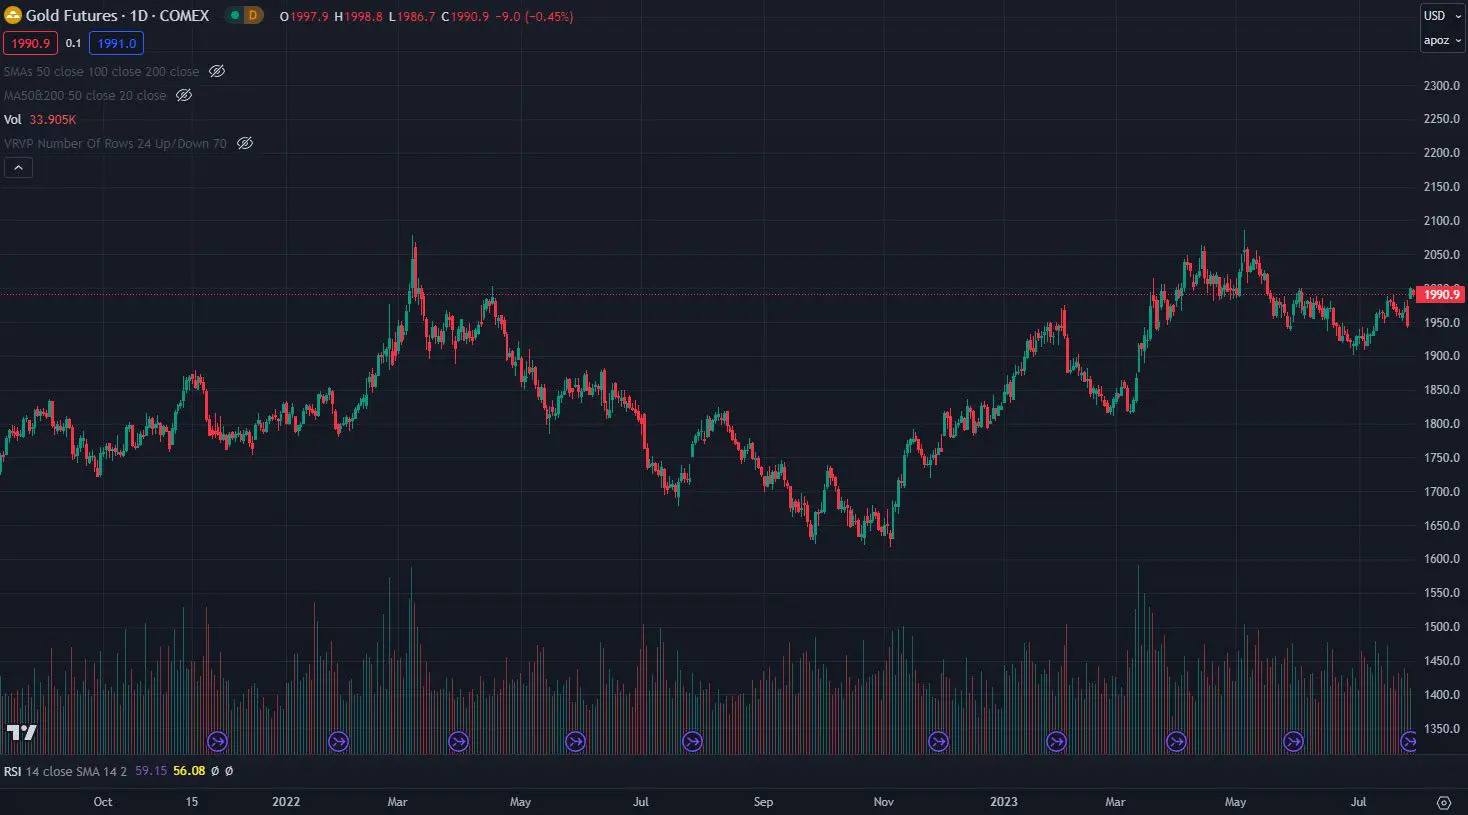
La piattaforma dedica ampio spazio anche ai futures, tra cui spiccano le principali commodities come oro, argento e petrolio.
Ciascun elemento dispone di propri grafici avanzati, indicatori, news e idee della community. Ecco un esempio: grafico su futures oro corredato da alcuni indicatori. Sulla destra abbiamo aperto la scheda delle relative news. Tutto è a portata di click, non dobbiamo cercare informazioni altrove.
Non possiamo non menzionare le azioni, tra le principali protagoniste su TradingView.
Oltre al mercato americano, la piattaforma propone grafici e informazioni su svariate compagnie, italiane incluse.
Presenti anche dati costantemente aggiornati su valute e tassi di cambio. Il trader in questi mercati troverà ciò di cui ha bisogno per portare avanti al meglio il proprio lavoro.
Interessanti anche i parametri economici e sui bond provenienti da numerosi Paesi. Sappiamo bene quanto sia fondamentale tenere monitorati dati come i tassi d’interesse e la disoccupazione: con TradingView è possibile.
Per ultime, di certo non per importanza, le criptovalute.
TradingView è un punto di riferimento per gli investitori nel nostro settore. I grafici sono esaustivi e permettono di confrontare l’andamento sia con le fiat currency che con altre crypto.
La community è molto attiva, perciò non mancano idee e informazioni. Insomma, possiamo essere davvero contenti.
"Una proposta enorme e che accontenta tutti: TradingView non delude le aspettative"
Panoramica sulle funzionalità di TradingView
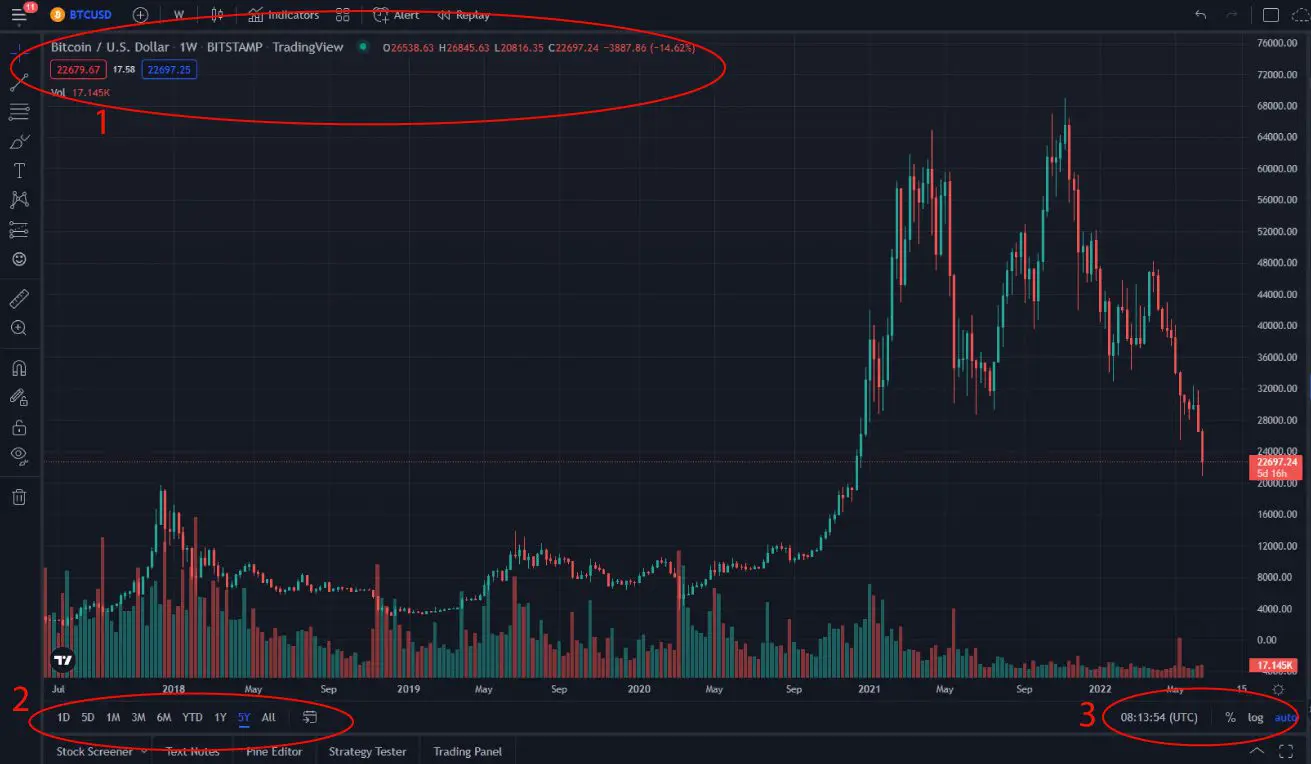
Ok, stiamo parlando già da un po’ ed è giunto il momento di dare un’occhiata all’interfaccia di TradingView. Ecco quindi una schermata di default relativa a BTC-USD.

Scomponiamo la pagina per conoscerla meglio.
Al centro torreggia il grande protagonista: il grafico (in questo caso TradingView BTC-USD). In questo caso lo vediamo con le candele giapponesi di durata settimanale. Poco più sotto troviamo i volumi.
Nella parte destra è invece ben visibile il prezzo di bitcoin, espresso in dollari americani. Spostando il cursore del mouse su un determinato punto, possiamo visualizzarne il valore in quel dato momento storico.
Nella parte alta si posizionano i pulsanti da cui modificare il grafico, aggiungere indicatori e impostare degli alert.
Precisiamo che alcune funzionalità potrebbero essere limitate o non disponibili nella versione gratuita: ci ritorneremo.
Inoltre, si può salvare il grafico, scattare uno screenshot e accedere alle impostazioni.
A sinistra troviamo i controlli per aggiungere commenti, linee e pattern. Il posto giusto per studiare, valutare i possibili scenari e creare le proprie posizioni.
Andando invece a destra, ecco i pulsanti con cui personalizzare (o rimuovere) la sidebar. Nel nostro esempio è visibile la watchlist personalizzabile. Nella foto vista in precedenza erano invece consultabili le ultime notizie.
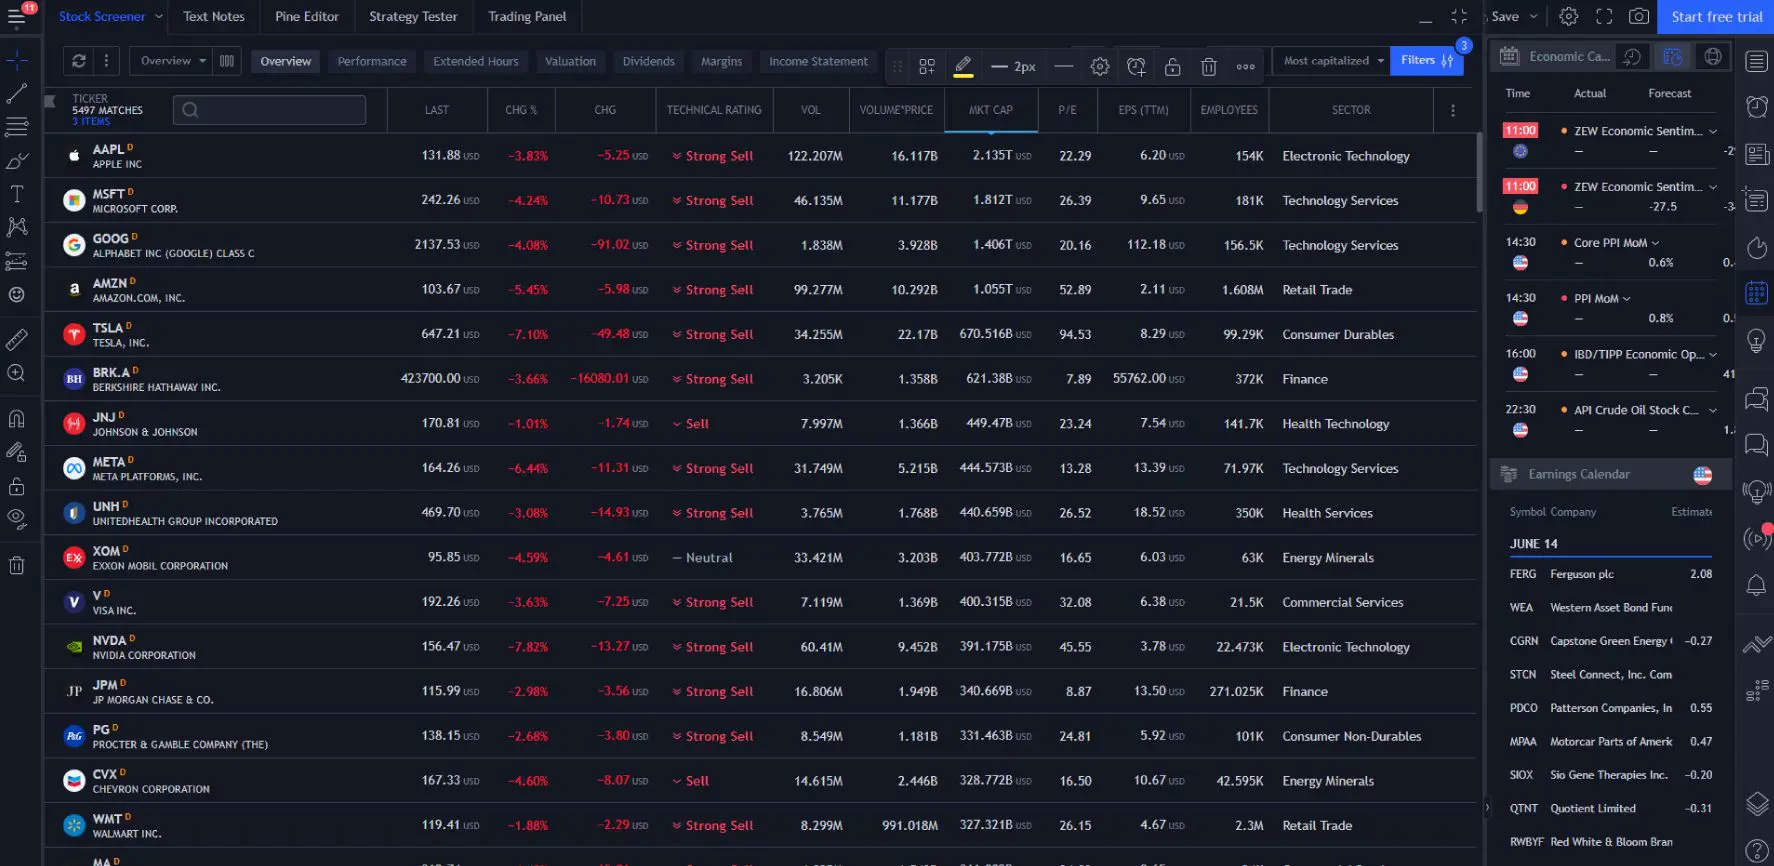
Infine, la parte sottostante. Nella schermata appena mostrata abbiamo volutamente ridotto a icona questa sezione. Volendo potremmo espanderla e consultare altri dati (come lo stock screener, vedi immagine sotto) oppure scrivere degli script.
TradingView concede massima libertà all’utente: sapendo ciò che si fa, è uno strumento potentissimo.
Basi di TradingView: grafico e indicatori
Andiamo più in profondità e conosciamo meglio TradingView. Partiremo studiando il grafico per poi spostarci su come modificarlo e impostare gli indicatori a disposizione.
Per migliorare la comprensione abbiamo scomposto la schermata in aree.
Via con la prima.
Ecco le informazioni indispensabili per capire cosa stiamo guardando.
In questo caso sappiamo che il grafico è su BTC-USD, fonte Bitstamp, candele con durata di una settimana (1W = 1 Week).
Troviamo poi altri dati contraddistinti dalle lettere O, H, L e C. Essi esprimono rispettivamente:
- O: Open, Prezzo di apertura;
- H: High, Prezzo massimo;
- L: Low, Prezzo minimo;
- C: Close, Prezzo di chiusura.
Infine, collegandosi al proprio broker è possibile accedere alle precise quote di acquisto e vendita (riquadri rosso e blu), nonché dello spread.
Spostiamo il focus sull’area 2, dedicata alla scelta dell’orizzonte temporale mostrato dal grafico. Si parte dal giornaliero (1D) e si arriva ai mensili e annuali. L’icona a forma di calendario consente di impostare intervalli personalizzati.
Modificando l’arco temporale, le candele giapponesi si adattano automaticamente. Ad esempio, il grafico giornaliero mostrerà di default le candele a 1 minuto; quello a 5 anni passerà invece alle settimanali.
Abbiamo comunque la possibilità di cambiare a nostro piacimento, a breve vedremo come fare.
Infine l’area 3.
Un’informazione fondamentale è l’ora, da avere sempre sott’occhio. Il fuso orario di default è l’UTC. Cliccandoci sopra si può modificare e scegliere quello di nostro interesse.
Chiudendo, evidenziamo la possibilità di passare alla percentuale e/o alla scala logaritmica.
Si tratta di funzioni utili per svolgere analisi più accurate e slegate da alcuni parametri. Condurre ricerche diverse è come guardare qualcosa da varie angolazioni: solo così si può apprezzare ogni dettaglio. Al contrario, il rischio è quello di perdere qualche informazione utile.
Spostiamoci sugli indicatori, accessibili dalla parte alta dello schermo.
![]()
Cliccando sul punto 1 potremo cambiare asset e relativo grafico. Si aprirà una schermata da cui digitare ciò che stiamo cercando.
Il pulsante 2 è dedicato alla modifica della durata delle candele (o delle altre visualizzazioni, dipende dalle nostre preferenze).
Alcuni intervalli sono disponibili solo con i piani a pagamento di TradingView. Tuttavia, quelli indispensabili sono presenti anche nella versione gratuita, perciò le analisi di base non vengono in alcun modo limitate.
Passando al punto 3, ecco dove cambiare la visualizzazione. TradingView propone le seguenti alternative: Bars, Candles, Hollow Candles, Line, Area, Heikin Ashi, Renko, Line Break, Kagi, Point & figure e Range. Se ti stai chiedendo di cosa stiamo parlando, nella sezione del sito dedicata all’analisi tecnica troverai tante risorse utili e gratuite.
Trasferiamoci al punto 4, cioè quello riservato agli indicatori. Cliccandoci sopra apriamo una schermata che trabocca di strumenti di ogni tipo.
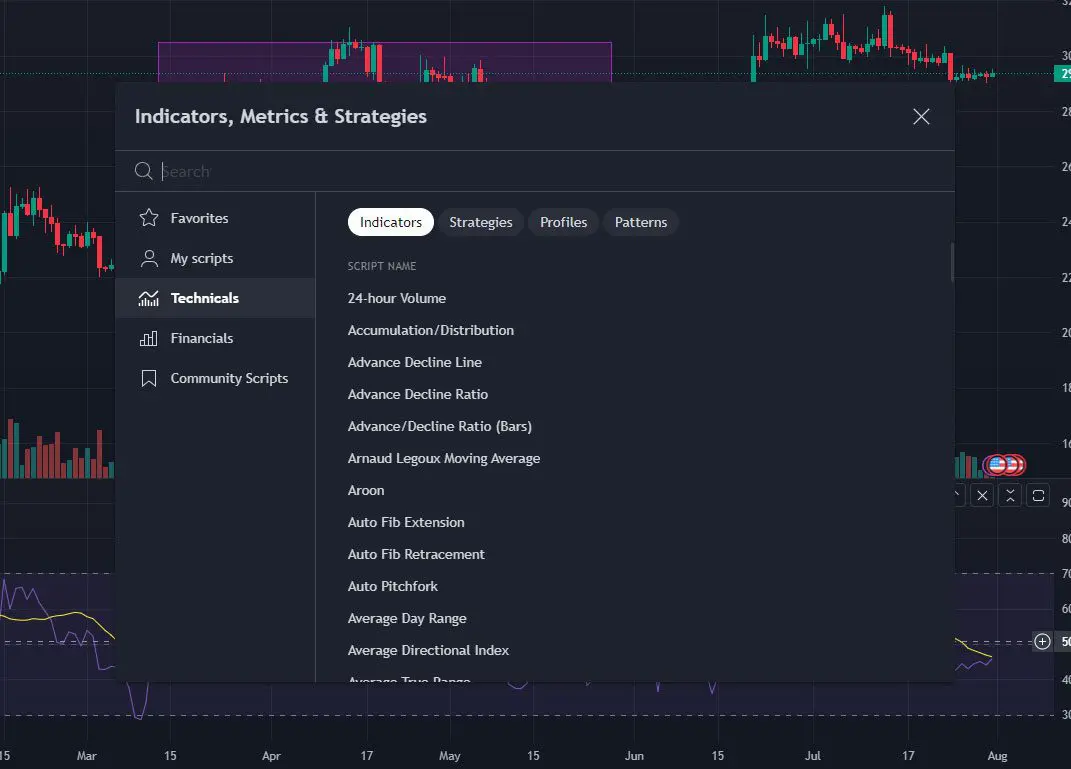
C’è l’imbarazzo della scelta. Attenzione però a non esagerare: consigliamo di utilizzare solo gli indicatori conosciuti, evitando quelli più complessi ed “esotici”. A volte l’abbondanza non è un bene, ricordiamocelo.
Infine, il punto 5.
Partendo da sinistra si trovano:
- Tasto per modificare il layout della pagina;
- Pulsante per salvare il grafico in questione, nonché farne una copia e condividerlo;
- Impostazioni (icona dell’ingranaggio), per una personalizzazione completa di TradingView;
- Fullscreen mode, per disporre di un grafico a tutto schermo e non farsi distrarre da nient’altro;
- Snapshot, così da poter scattare un’istantanea del grafico.
Quanta abbondanza, servirebbe un intero manuale per descrivere tutto dettagliatamente.
Comunque, l’aspetto di default è già completo e performante. Il nostro consiglio è quello di iniziare a utilizzare TradingView concentrandosi sul contenuto, personalizzando la forma nel corso del tempo.
"TradingView è lo strumento definitivo per l'investitore: servirebbe un intero manuale per descriverne tutte le funzioni"
Basi di TradingView: personalizzazione
Date le numerose impostazioni disponibili, era d’obbligo riservare un paragrafo alle personalizzazioni.
Anche in questo caso dobbiamo scomporre in più parti la schermata che segue.

Iniziamo con la prima area: una lunga lista di pulsanti posizionati uno sopra l’altro. Partendo dall’alto, descriviamo brevemente il loro scopo.
Nota: molti di questi tasti contengono un sotto-menu accessibile cliccandoci sopra con il tasto destro.
- Selezione puntatore mouse: cross, arrow, pointer o eraser (per cancellare quanto disegnato in precedenza);
- Linee: dalla semplice Trend Line ai canali paralleli, c’è tutto ciò che serve per impostare strategie e analizzare l’andamento di un asset.
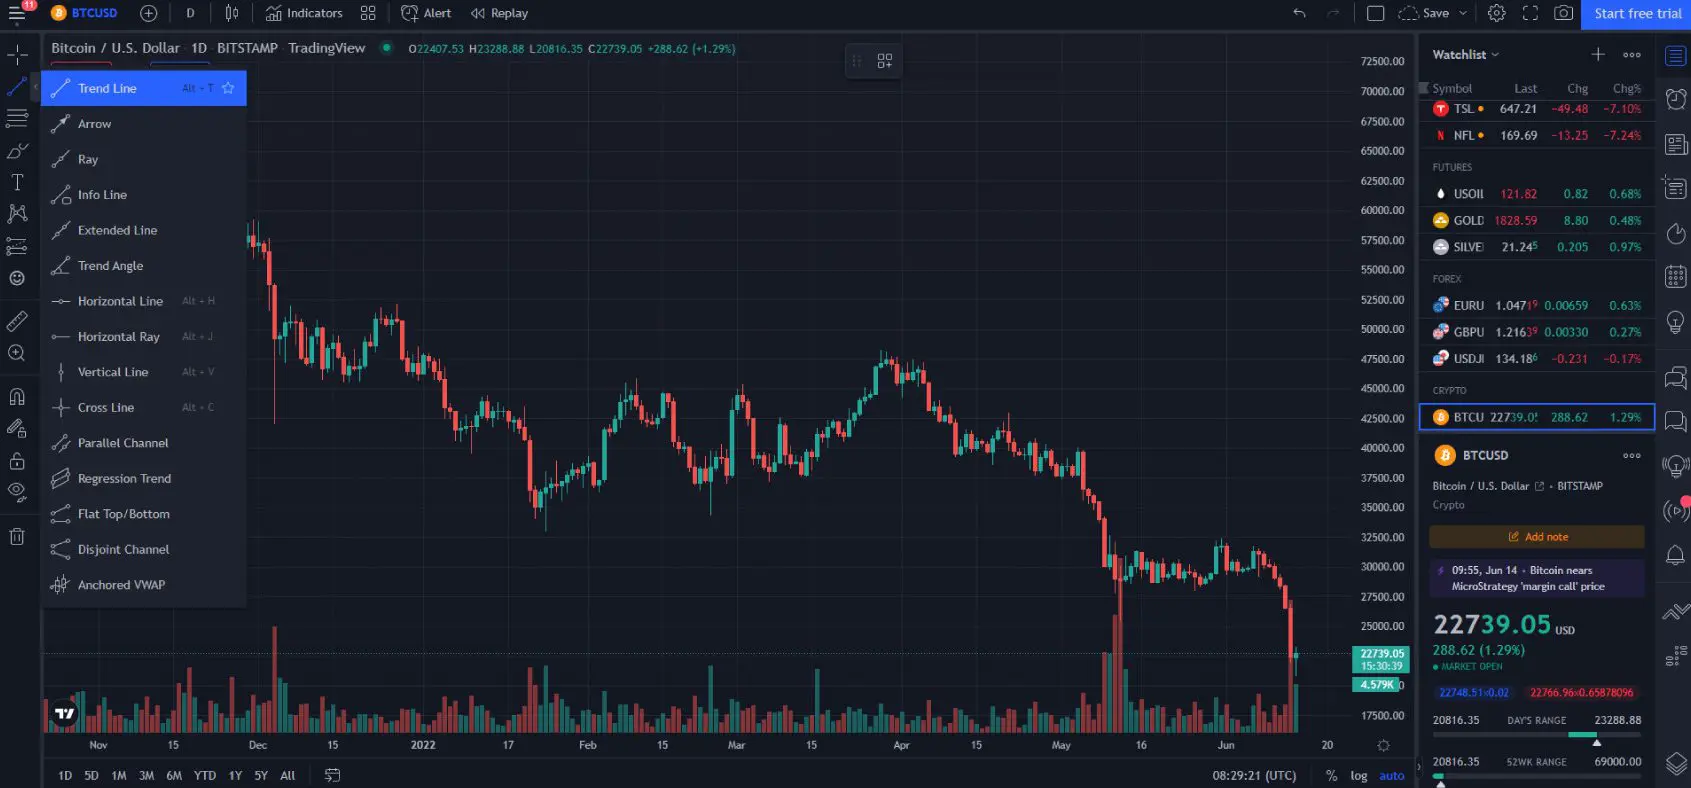
- Sezione dedicata a strumenti più complessi e precisi come Gann Box, ritracciamenti, circles e spirali. Insomma, una specie di gita a Disneyland per i trader più accaniti;
- Pennelli, evidenziatori, matite e forme di varia natura: tutto ciò che serve per non lasciare nulla al caso.
- Per essere ancor più precisi, perché non aggiungere del testo o un’immagine TradingView offre queste possibilità;
- Ecco un pulsante da cui poter inserire pattern e onde. Anche in questo caso, i più esperti apprezzeranno la libertà di movimento e personalizzazione;
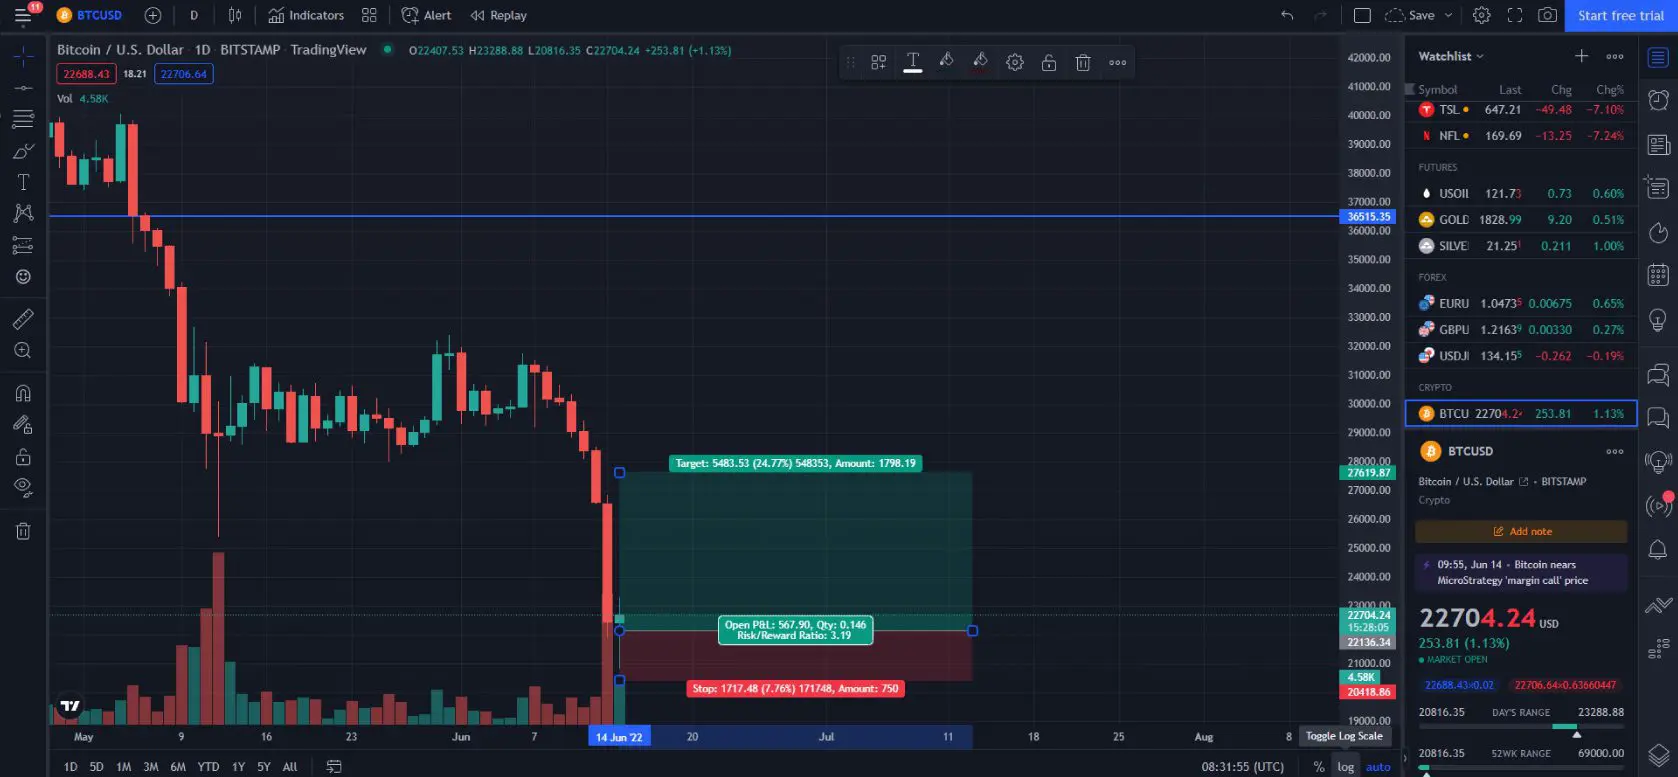
- Proseguendo, non possono mancare i range. Soprattutto, riteniamo fondamentali le funzionalità short e long position (riportate nella foto a fine paragrafo), perfette per attuare diverse tattiche e valutarne parametri come il rischio/rendimento;
- Ci serve un’icona? Un’emoticon? Le abbiamo! Ecco, forse qui si sta un po’ esagerando;
- Seguono altri tasti quali righello e zoom in. Uno dei più importanti è l’ultimo, il cestino: se avessimo esagerato e desiderassimo liberare il grafico, clicchiamo qui e il gioco è fatto.
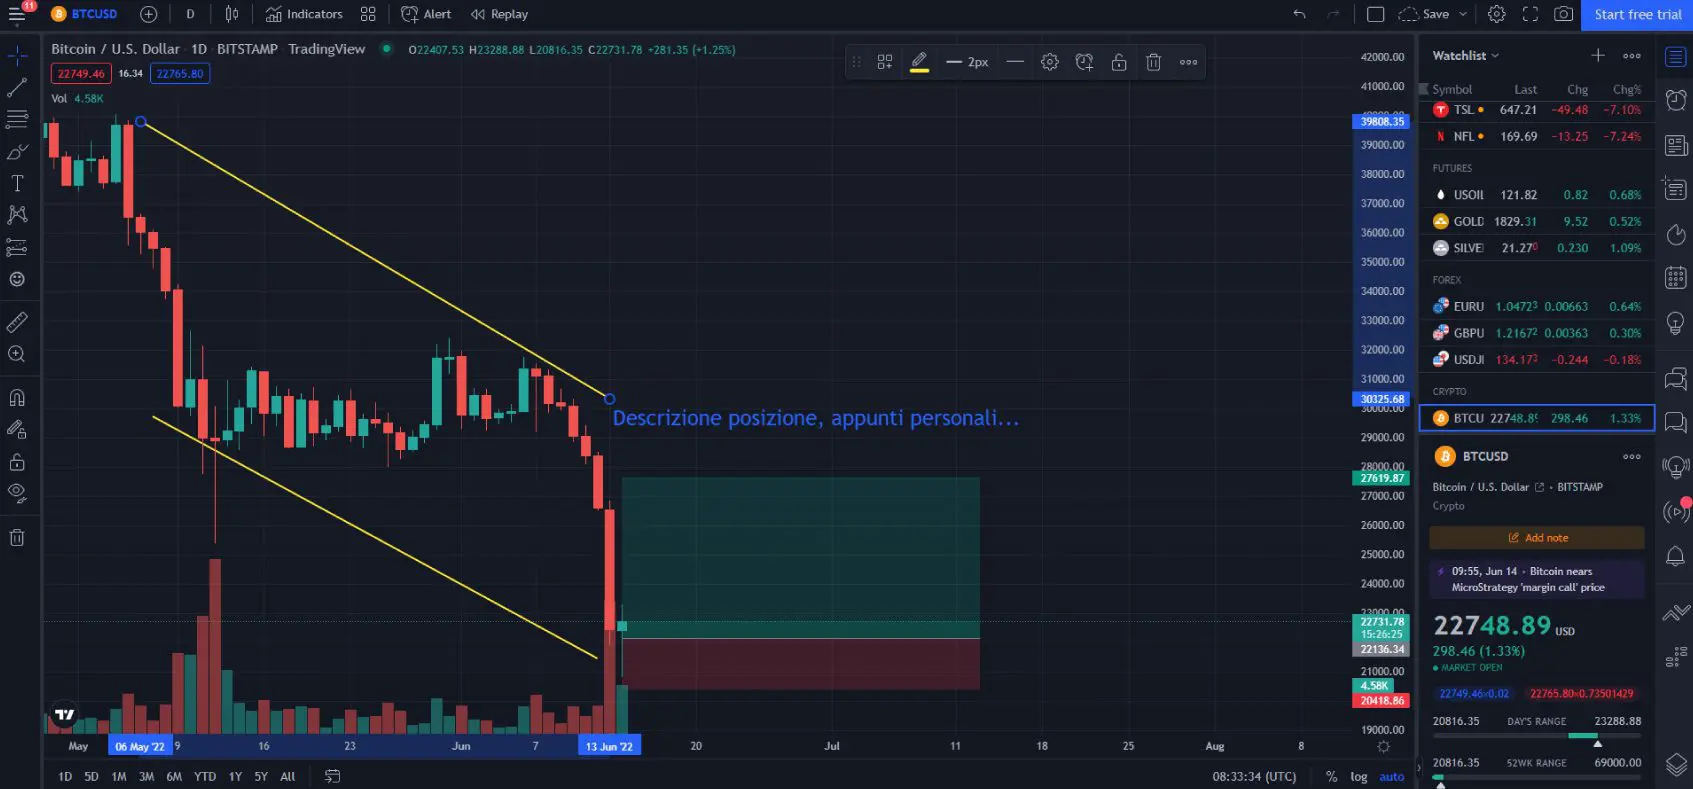
Dopo qualche personalizzazione, ecco come si potrebbe presentare il grafico. Tutto è stato impostato casualmente e solo per scopi didattici.
Spostiamoci all’area 2, interessante e ricca di funzioni.
Prima di tutto, la watchlist, completamente personalizzabile con gli asset preferiti.
Da segnalare anche le news. Esse sono collegate al soggetto del grafico: stiamo consultano BTC-USD? Visualizzeremo le ultime novità legate a bitcoin.
Alerts ci permette di impostare degli avvisi. Al raggiungimento di determinati livelli da noi decisi, riceveremo immediatamente una notifica. Disponiamo di un numero limitato di Alerts, basato sulla versione di TradingView posseduta.
Una funzione molto utile è il Calendar. Esso riporta i principali eventi legati a economia e finanza. Non perderemo mai più un dato sull’inflazione!
La chat pubblica è piuttosto frequentata. Bisogna sempre stare attenti a ciò che troviamo, perché non tutte le persone sono esperte. Tuttavia, l’insieme dei messaggi può darci un’idea indicativa dei sentimenti degli altri investitori.
Inoltre, connettendoci al nostro broker possiamo visualizzare i nostri ordini, sia aperti che chiusi. Un altro modo per evitare il continuo avanti-indietro tra piattaforme.
Altri pulsanti ci portano a hotlist, stream video e ancora di più.
Confermiamo: dovremmo realmente scrivere un manuale per trattare ogni funzione disponibile.
A tratti TradingView è forse troppo completo: bisogna stare attenti a non farsi distrarre da una proposta così ampia e capillare.
Come impostare RSI su TradingView?
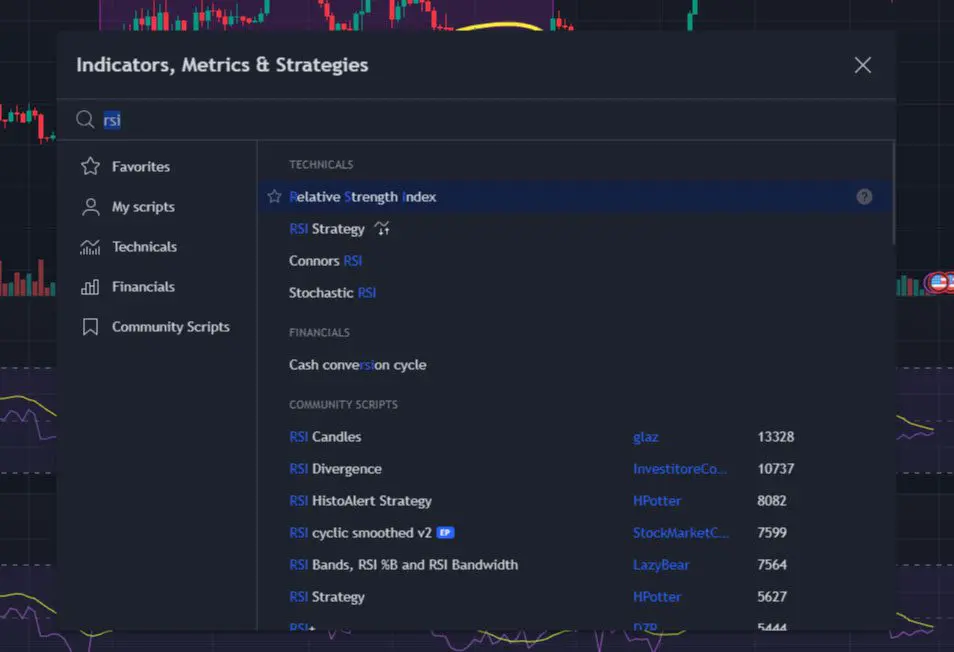
Dato che questo strumento è tra i più utilizzati, ecco una scheda operativa su come impostarlo.
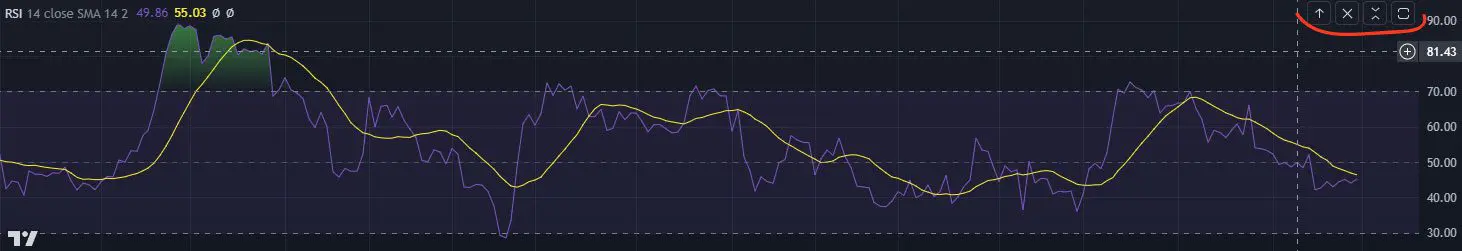
In primis, accediamo al grafico di nostro interesse. Dal menu posizionato in alto, clicchiamo su indicatori; digitiamo nella barra di ricerca RSI e vedremo le varie opzioni a disposizione. Scegliamo la prima voce, Relative Strenght Index.
L’indicatore comparirà sotto al grafico e sarà già pronto alla consultazione. Posizionando il mouse sopra di esso, compariranno dei pulsantini nell’angolo in alto a destra:
- La freccia ci permette di spostarlo sopra o sotto il grafico;
- La “X” serve per chiudere l’indicatore;
- Le due freccette permettono di ridurlo a icona;
- Infine, l’ultimo pulsante ingrandisce/rimpicciolisce l’indicatore.
Quanto costa TradingView?
L’account di TradingView può essere sia gratuito che a pagamento. Vediamo quali sono le differenze.
Se ti stai domandando “come avere TradingView gratis?”, sappi che basta iscriversi alla piattaforma. La versione libera è comunque ricca di funzionalità e consente di fare le proprie analisi senza particolari limitazioni. Rappresenta la scelta ideale per chi si è appena avvicinato al mondo degli investimenti (non solo in criptovalute).
Nel momento in cui si inizia a diventare un po’ più esperti, l’upgrade diventa però indispensabile per poter accedere a strumenti più evoluti e personalizzabili.
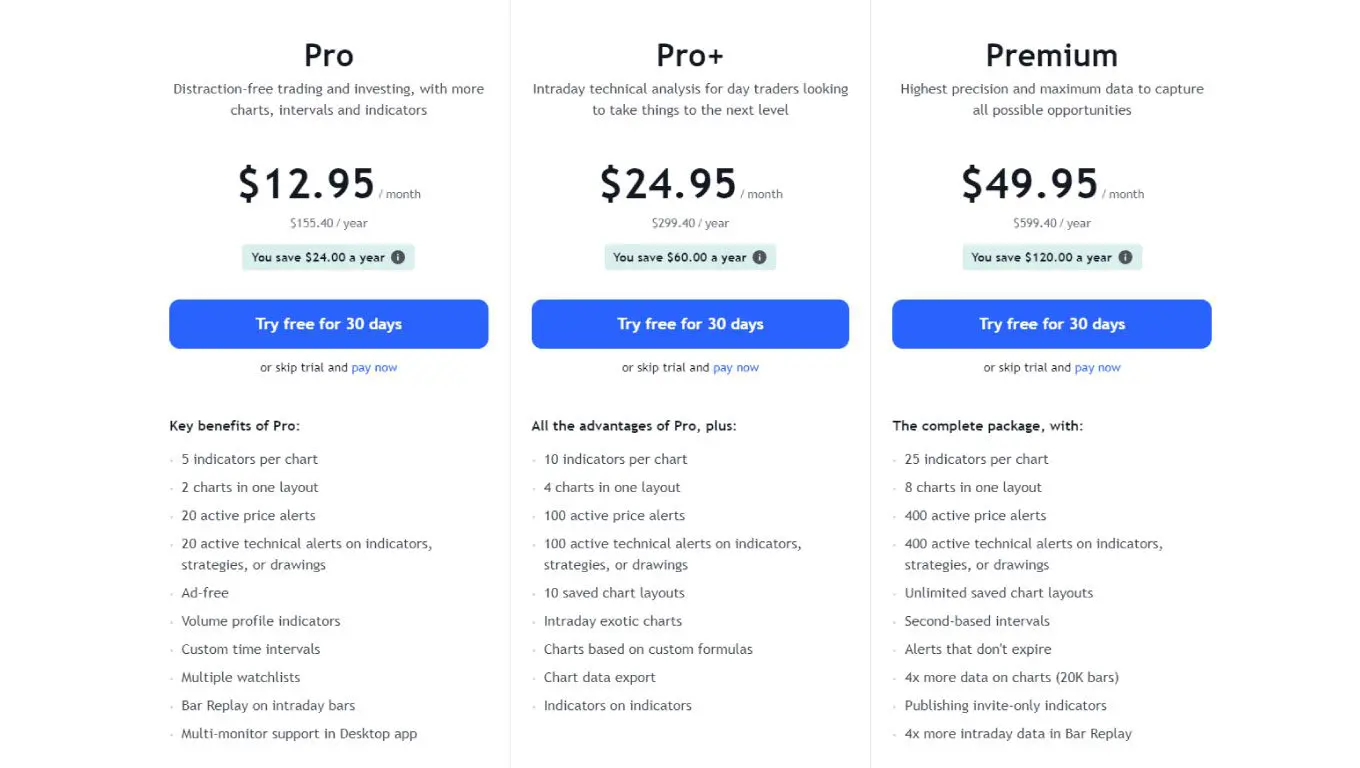
TradingView propone tre diversi piani a pagamento, ciascuno dei quali è pensato per soddisfare specifiche esigenze. Scopriamoli!
Piano TradingView PRO
Il piano PRO di TradingView è la porta d’ingresso. Rappresenta la scelta migliore per la maggior parte degli investitori privati. Ottimo rapporto qualità-prezzo.
Innanzitutto, ciascun grafico può ospitare fino a 5 indicatori. Inoltre, potranno essere visualizzati due grafici contemporaneamente nella stessa finestra.
Ovviamente, non verrà mostrata alcuna pubblicità, presente invece nella versione gratuita.
Molto interessante l’indicatore di volume; per intenderci, è quello che nei nostri video si vede posizionato a destra del grafico principale. Trattandosi di una funzionalità evoluta, le versione gratuita non lo prevede.
Completa l’offerta il supporto multischermo, utilissimo per chi necessita di avere molti dati immediatamente visibili.
I vantaggi non terminano qui: vengono sbloccati svariati indicatori, dati storici e approfondimenti.
Piano TradingView PRO+
Salendo di un gradino, ecco il piano TradingView PRO+. Si tratta di un’evoluzione del PRO, consigliato per investitori particolarmente esigenti. La scelta perfetta per chi opera intraday.
I grafici contemporanei passano da 2 a 4 (per layout). Anche gli indicatori raddoppiano e diventano 10.
Questo piano introduce anche diversi grafici intraday non disponibili in precedenza.
In caso di problematiche tecniche, da segnalare il diritto di assistenza rapida, una piccola evoluzione dalla versione PRO.
Il piano TradingView PRO+ prevede altre aggiunte che lo rendono un potente alleato se impiegato correttamente.
Piano TradingView Premium
Ecco la versione definitiva: TradingView Premium, l’opzione adatta a grandi investitori e professionisti del trading.
Ogni limite viene innalzato e ciascuna funzionalità è sbloccata. In poche parole: abbiamo tra le mani la fuoriserie dell’analisi tecnica.
Chiaramente, aumentando la dotazione cresce anche il prezzo. Soldi ben spesi, a patto di essere dei super esperti e con cifre importanti in gioco.
Parlando appunto di costi, essi variano in base alle offerte del momento e al pagamento. La quota mensile implica costi maggiori mentre quella annuale permette di risparmiare parecchio.
In aggiunta, qualsiasi piano prevede una prova gratuita di 30 giorni, così da poter capire se il prodotto fa effettivamente al caso nostro.
Ma c’è di più: se si dispone di un codice referral, il risparmio è assicurato!
Se sei interessato, ecco il mio referral TradingView com: se non hai mai acquistato un piano, ti aspettano fino a 30$ di bonus.
TradingView: super piattaforma di analisi
Chiudiamo questo lungo approfondimento elogiando ulteriormente TradingView, una vera super piattaforma per l’analisi tecnica e fondamentale.
Per quanto possiamo dire, nessun’altra realtà offre così tante funzionalità e personalizzazioni.
Non dobbiamo quindi stupirci se Trading Viewer è il servizio numero uno al mondo.
Utilizzi TradingView? Oppure conosci una valida alternativa di cui vorresti parlarci? I nostri canali social sono a tua disposizione.
Prima di salutarci, guarda il nostro video tutorial su TradingView, aggiornato al 2023. Troverai davvero tante cose interessanti e utili per migliorare la tua operatività.
Buon trading!