What is the Wyckoff theory?
The Wyckoff Theory is one of the most important in the trading landscape. In this article we would like to describe it in depth, but first let us begin with the usual introductions.
Richard DeMille Wyckoff first approached the world of the markets as a runner at a stock exchange at the young age of 15, at a time when electronic trading did not exist, which makes his ability to understand and schematise the relationships between buyers and sellers all the more astounding.
But, was Wyckoff a successful trader?
He became one of the most respected traders and analysts of his time, as well as being one of the richest men in America to the point of founding Wall Street magazine in 1907 and competing in the Hamptons for the best residence directly with the head of General Motors.
His logic was based, in part, on the analysis of effort and outcome: by observing the differences in reaction in certain areas of supply and demand and comparing them with volumes, Wyckoff was able to obtain an edge that was truly incredible in the markets of the time and still valid today, with due context.
According to Wyckoff there are basically three conditions in which the market can find itself and they all depend on the relationship between supply and demand. Let us go on and go into detail.
Index
- Law of supply and demand
- Law of cause-effect
- Wyckoff's Composite Man
- Wyckoff accumulation
- Wyckoff distribution
- Law of "Effort vs. Result"
- Momentum assessment
- Jump the Creek
- Break the Ice
- Targets in the Wyckoff trading strategy
- Entry into the Wyckoff strategy
- Stop Loss in the Wyckoff strategy
- Conclusions
Law of supply and demand
The law of supply and demand provides for the following relationships:
Demand greater than Supply:
The market will take bullish directionality as buying pressure cannot be met at the current price level, so sellers will be sought at the higher price levels.
Supply greater than Demand:
The market will take bearish directionality as the selling pressure cannot be met at the current price level, so buyers will be sought at the lower price levels.
Demand equals Supply:
The market will be trapped in a sideways or compression range, where the certainty of the trend is only confirmed by a clear directional breakout, showing that one side has indeed prevailed over the other (watch out for manipulation).

Law of cause-effect
Each phase is not only caused by market imbalances between supply and demand, but is the result of a series of previous events:
Each Mark-Up phase is the effect caused by an accumulation phase. In order to accumulate sufficient liquidity, buyers worked within a range, accumulating bullish positions and increasing the gap between supply and demand.
Each distribution phase occurs as a consequence of a bullish phase, as the price has moved into a supply-rich zone where sellers force the price into a range to accumulate bearish positions.
Every mark-down phase is caused by a distribution. To accumulate sufficient liquidity, sellers worked within a range, accumulating bearish positions and increasing the gap between supply and demand.
Each accumulation phase occurs following a bearish phase, as the price has moved into a demand-rich zone where buyers force the price into a range to accumulate bullish positions.
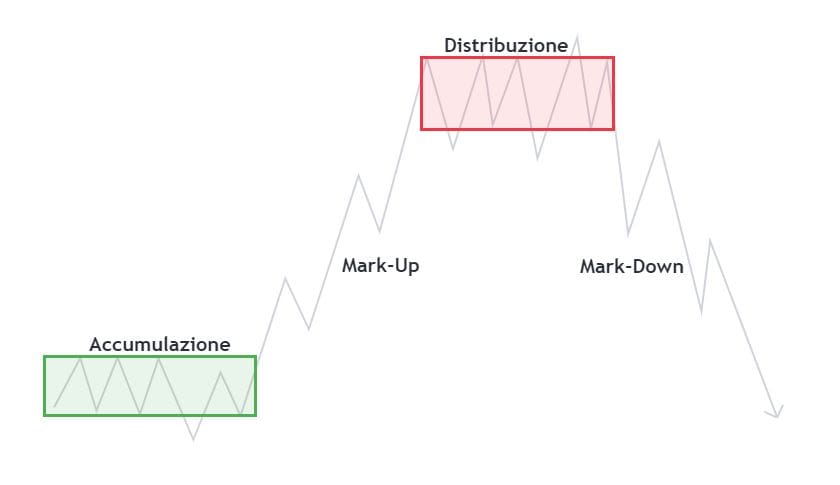
Wyckoff's Composite Man
Wyckoff created the concept of the Composite Man (or Composite Operator) as a fictitious market entity.
According to this idea, investors and traders should study the market as if a single entity was controlling it, thus making it easier to follow trends and spot turning points.
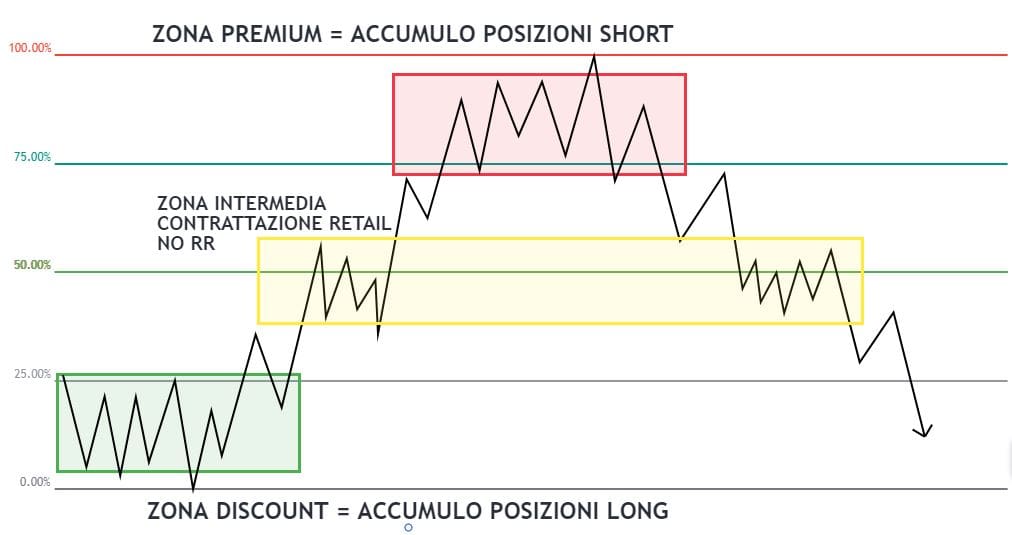
In essence, theComposite Man represents the main players that move the market, thanks to the large volumes they move and the information asymmetries they exploit, to the detriment of small investors. They always act in their own interest to be able to buy at low prices (DISCOUNT) and sell at high prices (PREMIUM).
But according to Wyckoff, the Composite Man uses a relatively predictable strategy that investors can learn from.
We use the Composite Man concept to illustrate a simplified market cycle. Such a cycle consists of four main phases: accumulation, uptrend, distribution and downtrend.
Wyckoff accumulation
The accumulation phase results, as we have seen, from the price entering a discount zone, where the Composite Man will consider the risk-return ratio to be advantageous to buy long positions for the asset in question.
This phase develops in a more or less defined price range; as market understanding evolves and these concepts become more widespread, the zones lose their importance as they were originally structured, but the logic of movement does not.
The composite man must accumulate most of the liquidity, driving the market in false directions, until he has accumulated enough positions to generate the Mark-Up.
But what are the 4 phases of Wyckoff? Richard has gone into every time and price action phase of his charts, going into detail on both the psychology and the chart result, but let us not forget these two fundamental aspects:
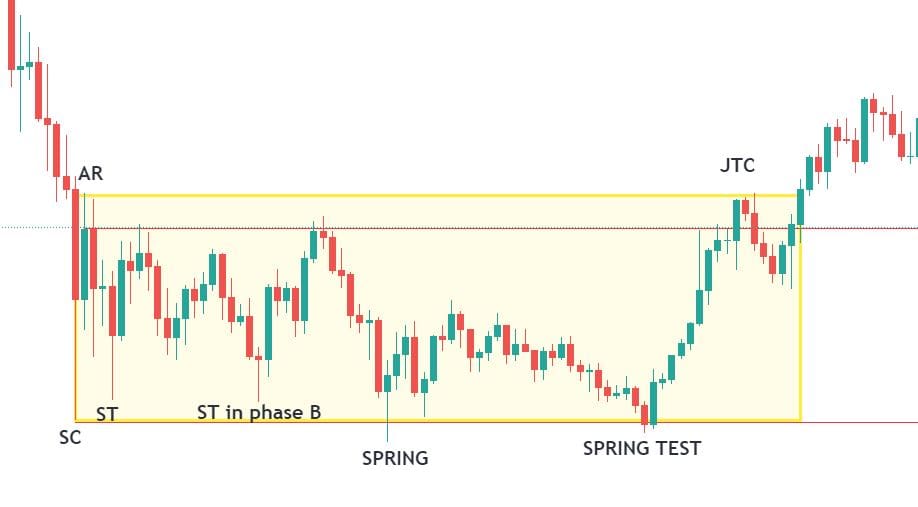
- It can be a valuable exercise to recognise and identify each individual phase of the accumulation (PS, SC, AR, ST, SPRING, JTC);
- Remember that too much analysis leads to paralysis; you will get paid for being able to exploit the accumulation phases, not for accurately identifying each nomenclature.
Wyckoff distribution
The distribution phase has opposite characteristics to the accumulation phase.
It develops following a price landing in a premium zone, where the composite man finds the final distribution of profits and the accumulation of short positions convenient (in terms of RR).
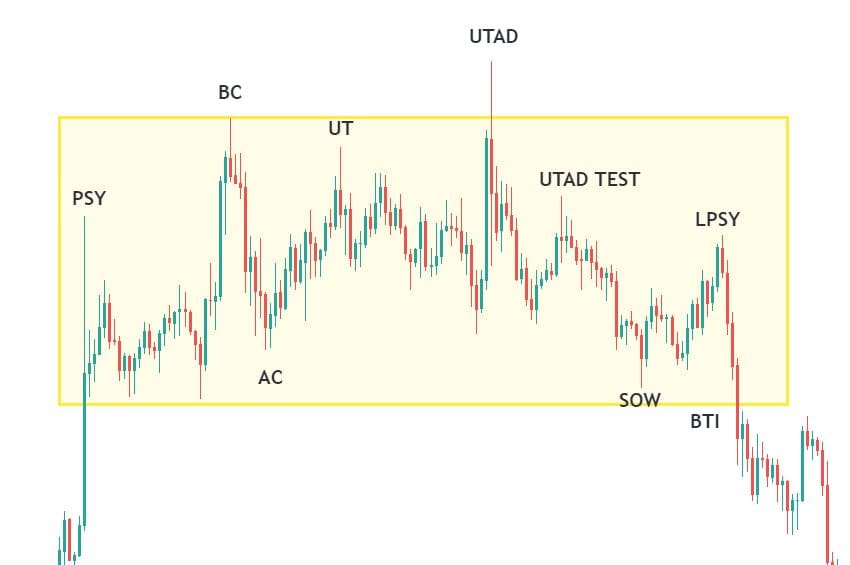
Similarly to the accumulation phases, we have the price stationing in a more or less defined range, inducing investors to enter the market following false breakouts and reabsorptions, only when the buying pressure is completely absorbed and the supply is at its maximum we have the exit from the distribution range and the beginning of the Mark-Down.
Law of "Effort vs. Result"
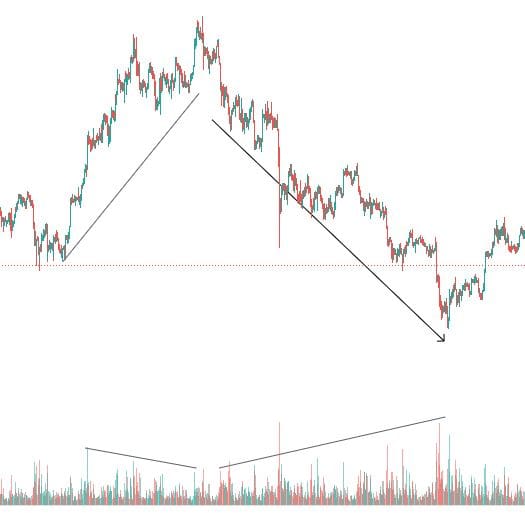
The Law of Effort vs. Result helps us to assess the divergence between the volumes entered the market in a certain timeframe and the result obtained at price action level. Let us give some examples:
- When a mark-up or mark-down phase is supported by increasing volumes the trend is genuine;
- When a trend continues in its directionality and at the same time volumes lose intensity, the trend is exhausted;
- When in the accumulation/distribution phase the price lateralises and volumes increase, we can expect sufficient volatility to exit the ranging market phase.
DISCLAIMER: Volumes displayed on exchanges refer to individual exchange volumes. For a more accurate use of these valuations, one would need to trade in a centralised market or have an aggregated view of all exchange volumes on the asset.
Momentum assessment
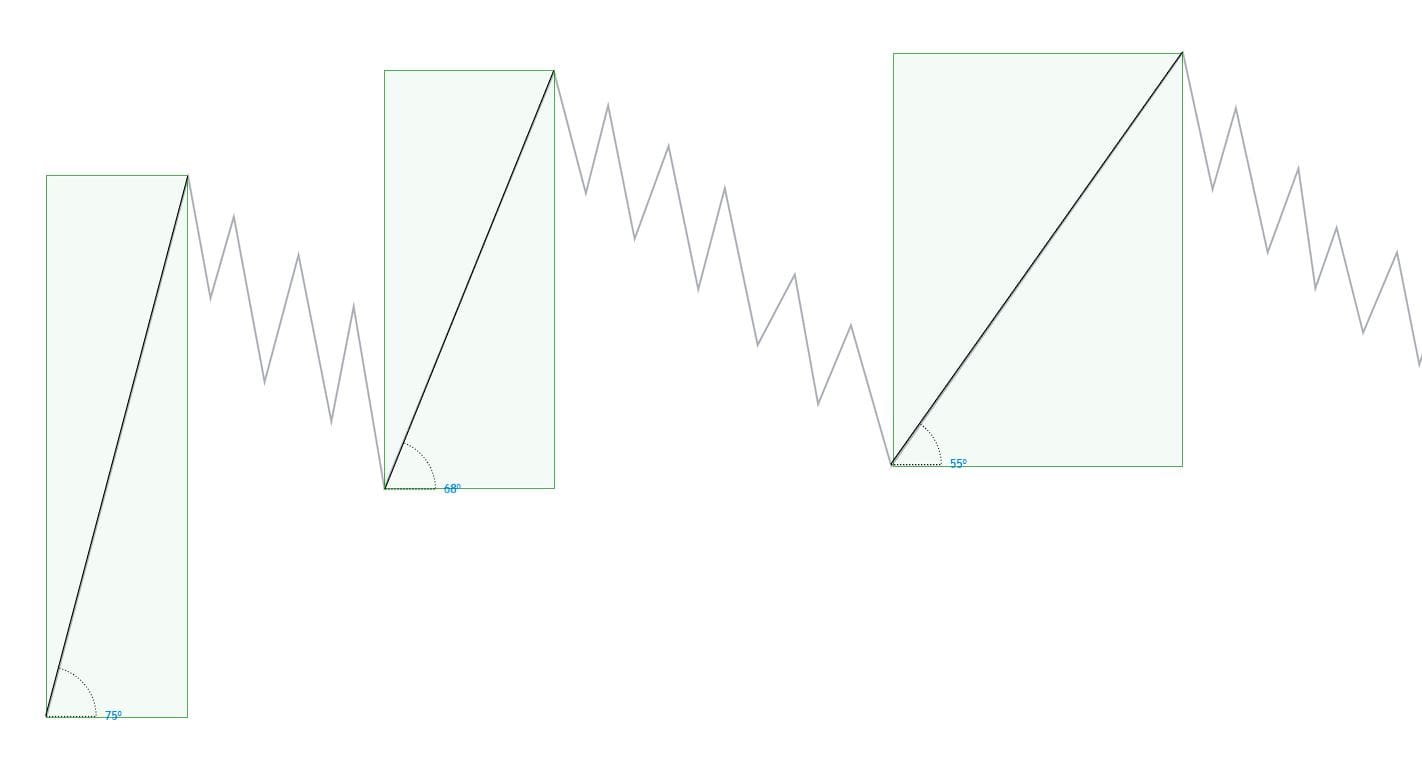
The price momentum assessment allows one to detect the exhaustion of the strength of a trend.
In the case illustrated below, we see how with each excursion the price shows less impulsiveness (decrease in angle) and takes longer to execute the same amplitude of movement (ratio of height to width of green rectangles).
This characteristic clearly communicates to us that bullish interest is diminishing, alerting us to a possible reversal on the way.
In the same way we can reason with respect to bearish movements, where downward impulses follow one another with less intensity, leaving more and more room for lateralisation, we may have entered an accumulation zone.
Jump the Creek
We realised that in addition to purely theoretical knowledge, we must be able to use these notions to our advantage, let’s dive in the Wyckoff Method.
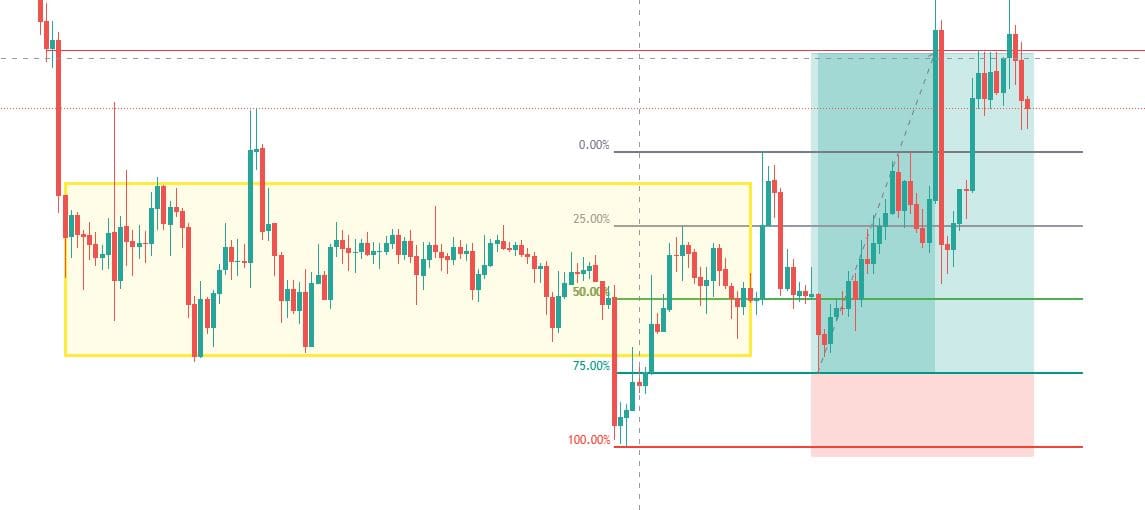
One of the trades with the highest winrate, linked to these logics, is the trade that exploits the exit from the accumulation and distribution phases by intercepting the Mark-Up/Down phases at the origin.
Let’s look at them one at a time starting with the trade exiting the accumulation phases, the so-called Jump the Creek.
The positioning involves the identification of a liquidity grab or Spring, and a subsequent re-entry into the range supported by good volumes. After that, one may or may not wait for a test of the spring, but what counts is the impulsive move to break the previous resistance structures.
This shows long interest, ‘a jump’ that manages to overcome the various previous bidding zones, landing beyond an imaginary stream of short pressure.
DISCLAIMER: This is not an invitation to invest and past performance is never a guarantee of future results. In order to trade the market with more awareness you need to know what you are doing, perform a proper backtest and never risk more than you are willing to lose.
Break the Ice
The metaphor of the Break the Ice helps to understand the dynamics of the trade coming out of the distribution phases.
We then wait for the price to approach a high potential bearish reversal zone, initiating a ranging market, after which we wait for the swing over the highs of this range, also called UTAD (Up trust after distribution), followed by an immediate and sustained re-entry into the zone. This movement has the same function as the spring, i.e. to induce the market players into a false directionality, accumulating enough counterpart to continue the bearish directionality.
Again, the test of upper liquidity depends on the intensity of the selling pressure, often after the manipulation the train leaves without letting us get on.
The definitive sign that indicates to us the conclusion of the distribution phase and the beginning of the Mark-Down, is precisely the BTI, we have a break of the supports and the lower zone of the range (break the ice) with a possible return to test the internal liquidity, and then head to the next demand zone.

Targets in the Wyckoff trading strategy
These are technically the zones and the reasoning that must take place when evaluating entry according to this logic.
But how exactly do I identify the precise point at which to enter and place target and stop?
Let’s address each of these points to try to understand how to manage the trade and how to conduct a substantial test of this strategy.
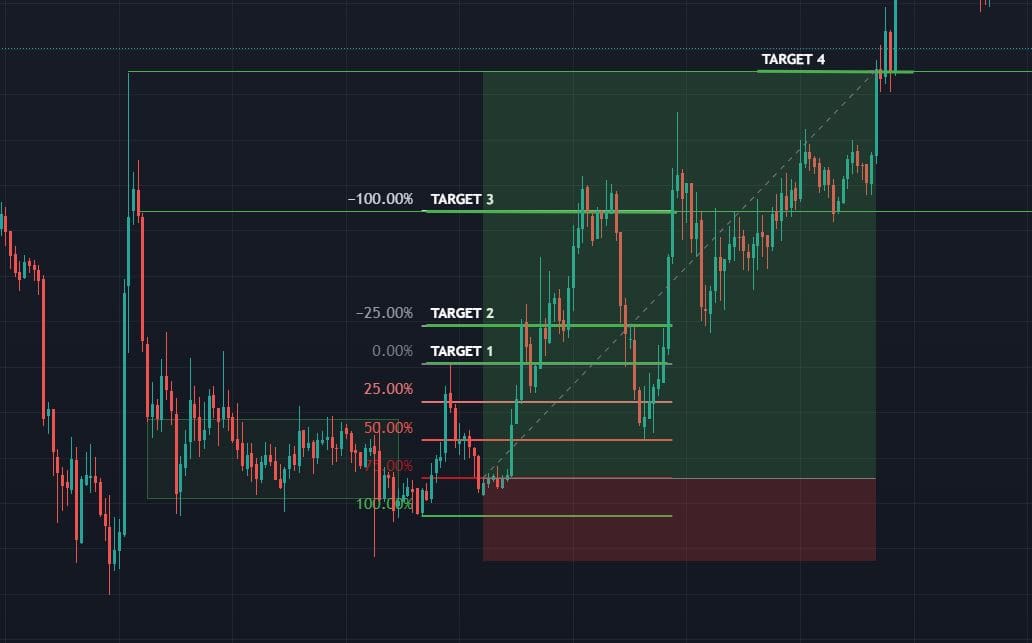
Let’s start with the profit liquidation point, also known as the target, as this depends very much on the type of strategy and time horizon. It tends to be the case that the underlying demand zones and potential reversal zones should represent, at the very least, partial profit-taking.
Identifying a statistical pattern of average RR can also work, if out of 100 distributions you observe that 50% achieve at least an RR of 1/2 you will know that target 1 can be placed at 1/2.
Entry into the Wyckoff strategy
The entry in the Wyckoff strategy is probably the most delicate part, the use of pending orders (limit order) risks letting you enter even where a discretionary analysis would have advised caution, but for the sake of fairness let’s also deal with entry via pending.
The possible entrances in this case, for both JTC and BTI, are divided into conservative and aggressive, identified as follows:
- Conservative: allows you to wait for numerous confirmations from the price, this is to the detriment of the risk-return of the operation and increases the risk of drawdown to be borne, it does however ensure a greater number of entries. The order is placed on the test following the upper (jtc) or lower (bti) breakout of the lateralisation range.
- Aggressive: wants to maximise risk-return by positioning only if the asset gives a test of the spring (jtc) or UTAD (bti). As an entry point one tends to select either the highs prior to the manipulation (top range, pre-spring/UTAD) or tracing a fibonacci from the highs to the lows of the reabsorption movement, either wait for a return to the discount zone of the impulse.
This same type of entry can be assessed in a discretionary manner , waiting for confirmation from price, i.e. a decisive directional move or clear elements of trend reversal.
Discretion affects the return risk but allows us to increase the winrate, as only once the asset has given us confirmation do we actually decide to enter.
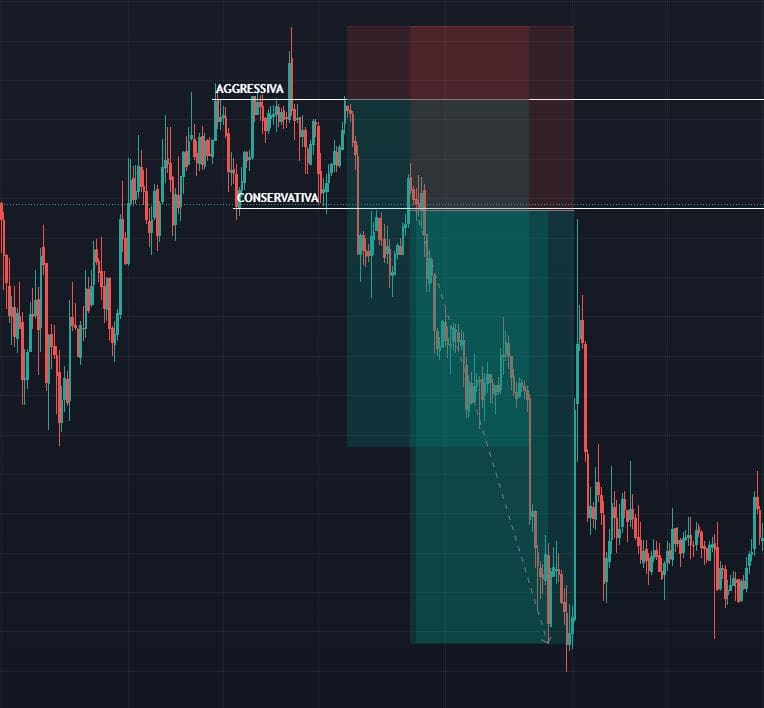
Stop Loss in the Wyckoff strategy
The stop loss is, as we well know, another fundamental element of the trading activity, its correct position allows us to avoid useless liquidity grabs, stop hunts and the like.
Here too, depending on the type of trader and strategy, we can position the stop aggressively or conservatively, it depends very much on the structure of the case, but in general this is how they can be defined:
- Conservative: the starting point is always the identification of a potential reversal zone, if the distribution occurs within the zone, the point at which to position the stoploss conservatively is just outside the zone. Statistics, in addition, allow us to decrease the probability of a stop loss impact by testing the repetitive behaviour of the asset following our entries.
- Aggressive: here we consider more than the reversal zone, the distribution/accumulation process: We evaluate that due to this movement sellers are in control and buyers cannot violate their dominance points, so we position the invalidation point of the analysis the extremes of the manipulation (spring/UTAD).
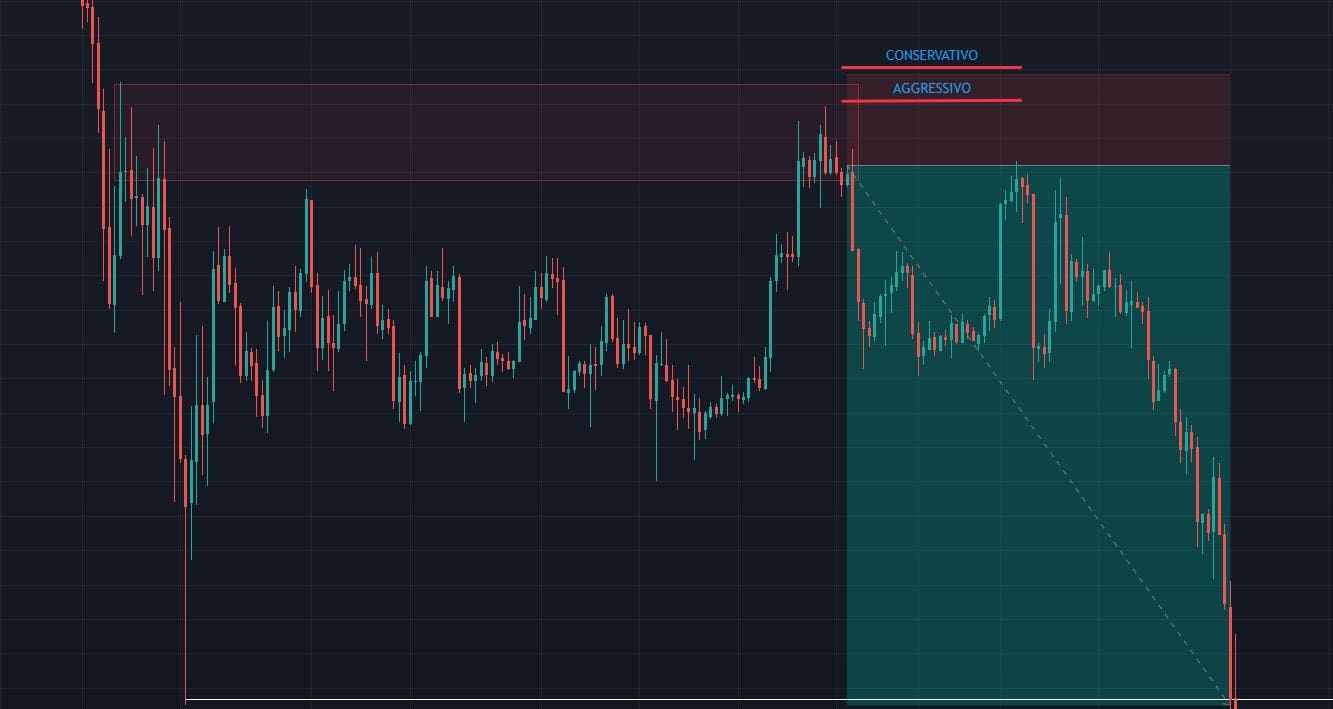
Conclusions
I would like to conclude with some illuminating quotes from Mr Wyckoff:
‘Your judgement will start to become impaired if you listen more to your ego than to what the market is telling you; You have to learn to carefully observe the information the market is telling you’.
In short, we are not rewarded for formulating theories about how the market will behave, but for following it to the letter. And again:
‘Listen to what the market tells you about its participants and not what its participants say about the market’.
This is a central point in the path of growth as a trader, of each of us, as we have repeated several times in our articles: never take theories and strategies literally, always test the results on the chart yourself, to be involved in understanding the method, to understand its strengths and weaknesses, and to be more confident when entering the market.
In general in the market, these two rules are important, but even more so in the cryptocurrency market where the concepts of ‘Don’t trust, verify “ and ”Do your own research ’ are core values of the ecosystem.
In the hope that this article may have stimulated your growth and research, thank you for your attention and see you next time.

