

Introduction
Charles Dow, born in 1851, was an American journalist and entrepreneur. Together with two other co-founders, he founded the company Dow, Jones and Co. from which the famous American index of the 30 best companies originates: the Dow Jones industrial average, for his friends Dow Jones.
In addition, Charles also founded the famous business newspaper The Wall Street Journal.
As we can see, Mr. Dow gave birth to the world’s leading economic news and equity index, but he did not stop there: thanks to the Dow Theory, he laid the foundations for today’s technical analysis, let’s see what it is all about
Index
The 6 Dow Principles
The starting points for understanding the theory in question are the 6 basic principles according to which a trend can be qualified:
- There are three types of trend in the market
- Primary: Macro directionality of the asset
- Secondary: Characterises more pronounced retracements, always respecting the dominance of the macro-trend
- Minor: Volatility within the secondary trend
- Trends are divided into three phases:
- Accumulation: Entry by institutional investors
- PublicParticipation: predominant entry by retail traders
- Distribution: massive profit-taking by institutional investors, a condition of market overextension
- Stock market indices must confirm each other: a healthy correlation between common market indices is a good signal for the market, we will see later how to exploit discrepancies;
- The market discounts all news, very often even before it becomes public (buy the rumours, sell the news);
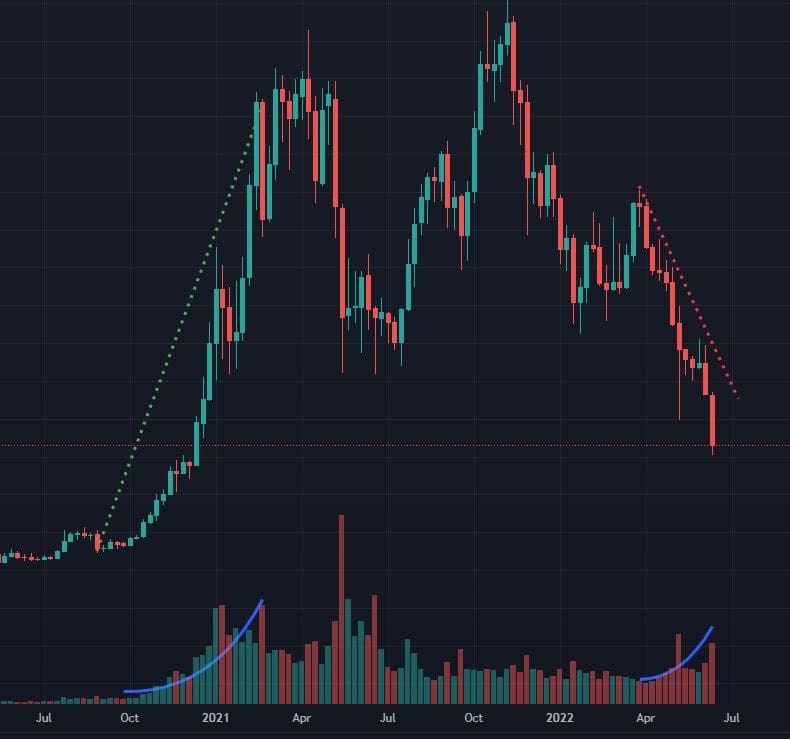
- Volumes must confirm the trend, as a matter of increasing public participation;
- The trend remains confirmed until a clear reversal: combination of price action and volumes.
The market discounts everything
The price of an asset, reflects any variation related to the current supply and demand in the market.
From this assumption about the nature of the market, derives what is now the concept of leading and lagging: compared to indicators and oscillators, which give a posthumous indication to certain variations (lag) , price and volumes discount market information in advance, leading (lead) the trend and influence indicators.
The Market is Formed by Three Trends.
According to this principle we have three trends, or tendencies, within the history of an asset:
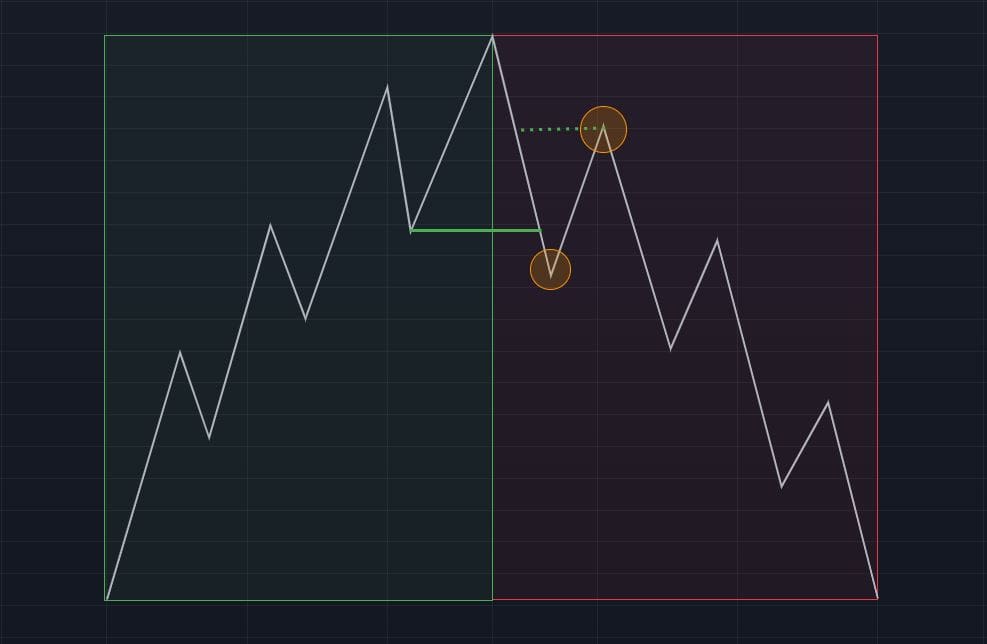
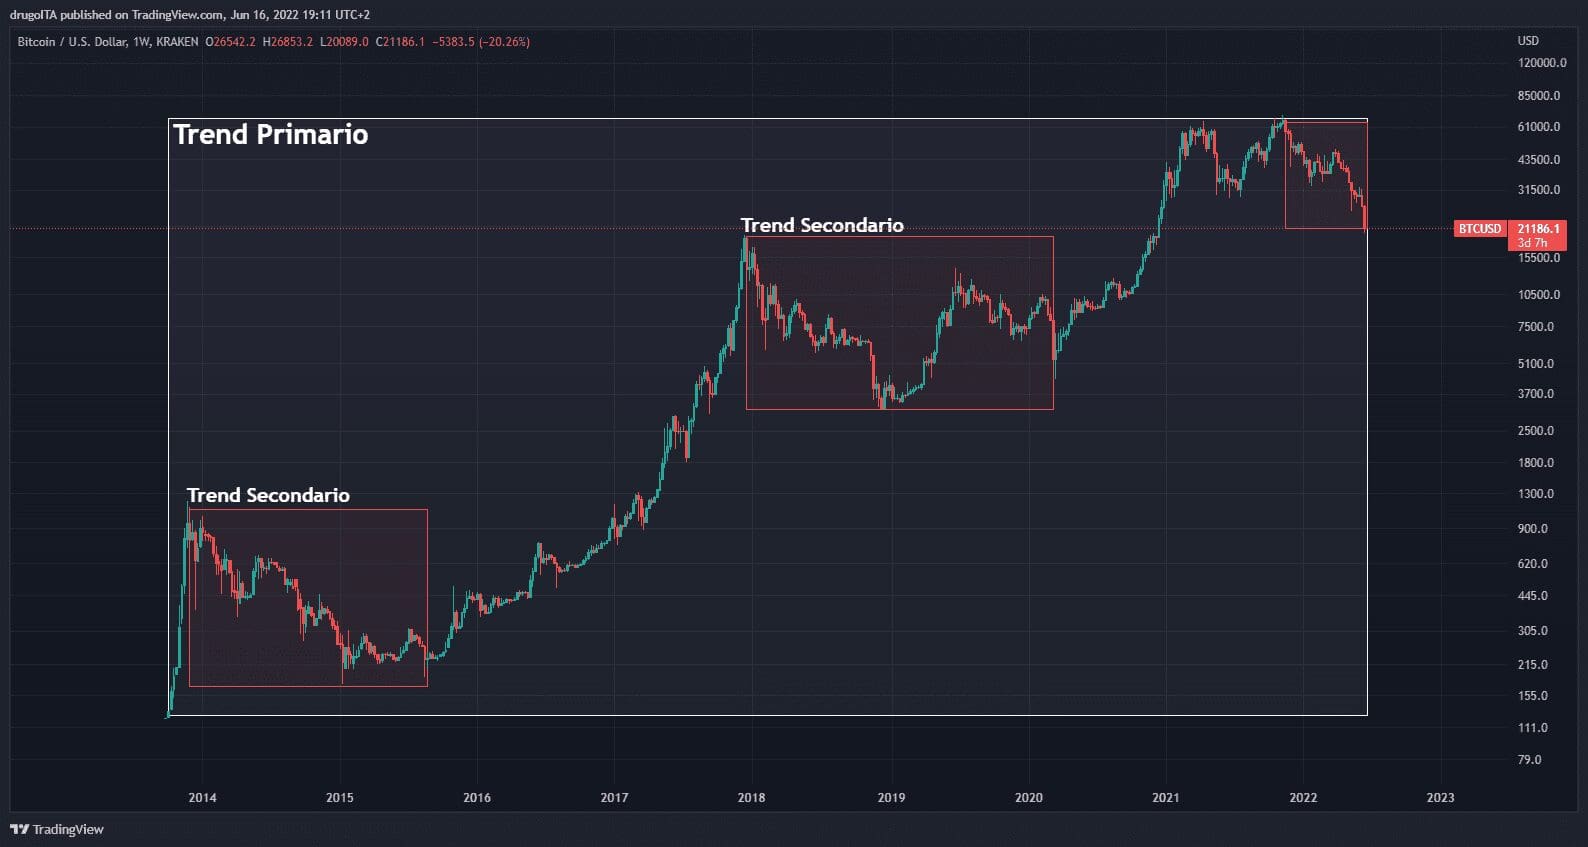
- PRIMARY TREND: the primary trend represents the macro directionality of an asset, which can be measured both in terms of time (longer than 12 months), and in terms of prevalence over other trends (one-way assets).
- SECONDARY TREND: represents equilibrium, an inverse correction with respect to the primary trend, tending to last less than a quarter. It is considered a secondary trend, as long as it respects the structure of the long-term primary trend.
- MINOR TREND: corrections within a secondary trend, have less relevance to the scholars of this theory, as they are subject to numerous false signals. With proper interpretation, however, minor trends allow us to construct the confluences necessary to intercept the end of the secondary trend in order to realign with the primary trend and vice versa.
"101 on market trends: A bullish trend is structured as a series of rising highs and rising lows, while a bearish trend is characterised by falling highs and falling lows, both of which are ultimately governed by the law of action and reaction."
Classification of primary trends
Mr. Dow focused his attention mainly on primary trends, further classifying them into three phases, which then became the starting point for more advanced theories and laid the foundations of modern technical analysis (see article on Wyckoff), let’s see them together:
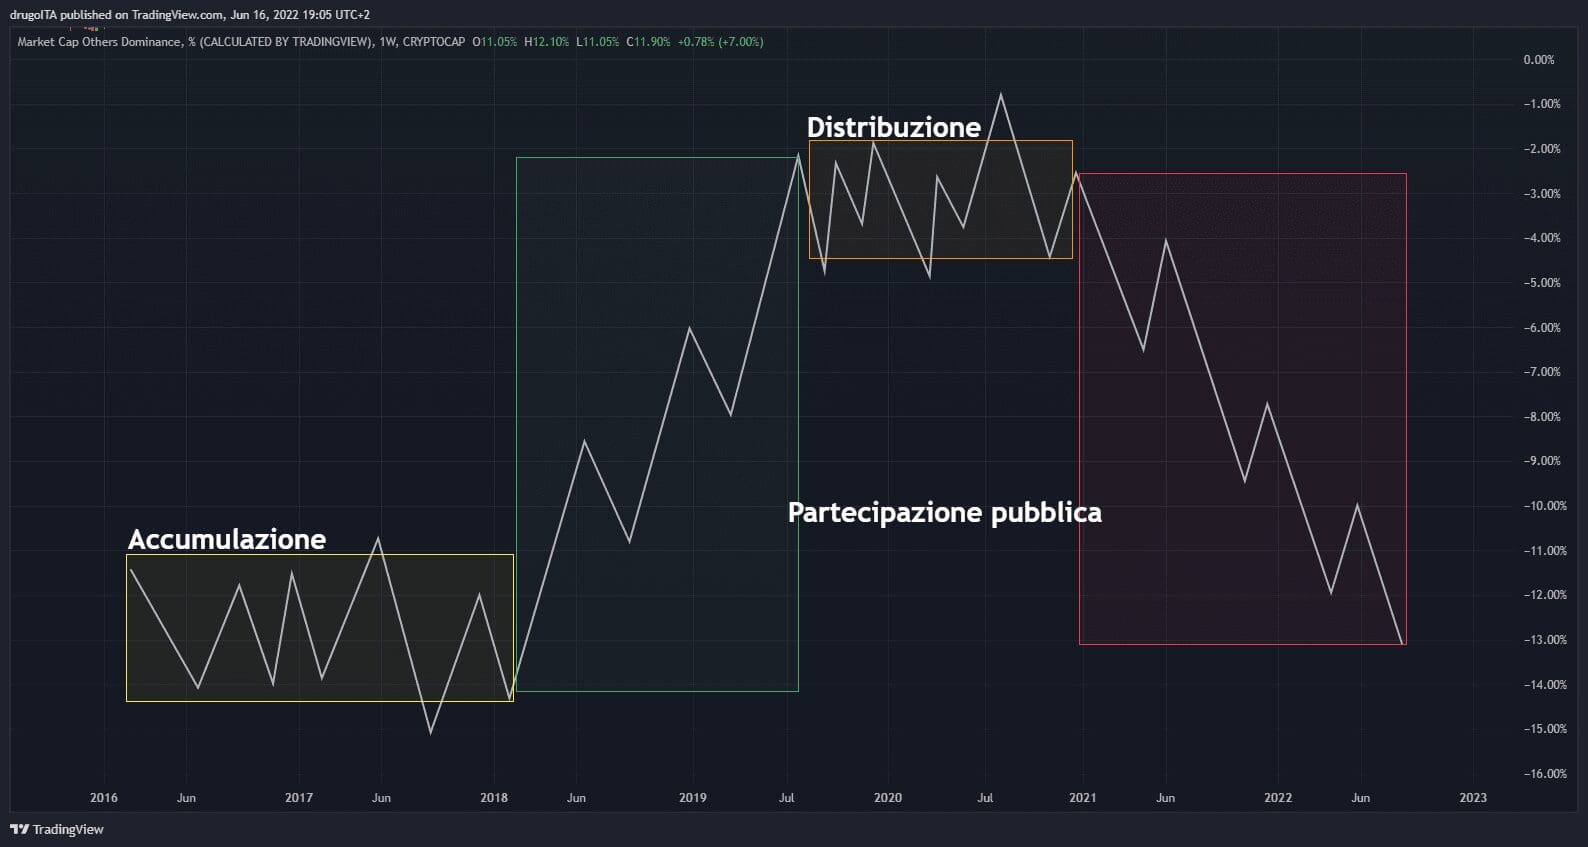
- ACCUMULATION: Professional traders notice an exhaustion of the secondary trend and take positions, for realignment to the primary trend (consolidation following a phase of maximum euphoria in a long trend or panic in a short trend).
- PUBLIC PARTICIPATION: the primary trend evidently resumes its direction involving the participation of typically retail traders, while professionals consider a partial profit-taking.
- DISTRIBUTION: participation in the primary trend is so broad as to lead professional traders to unload a large part of their positions, counteracting retail participation in the trend, thus creating a divergence between supply and demand (based on the directionality of the trend) and giving rise to a new secondary trend.
The indices must confirm each other.
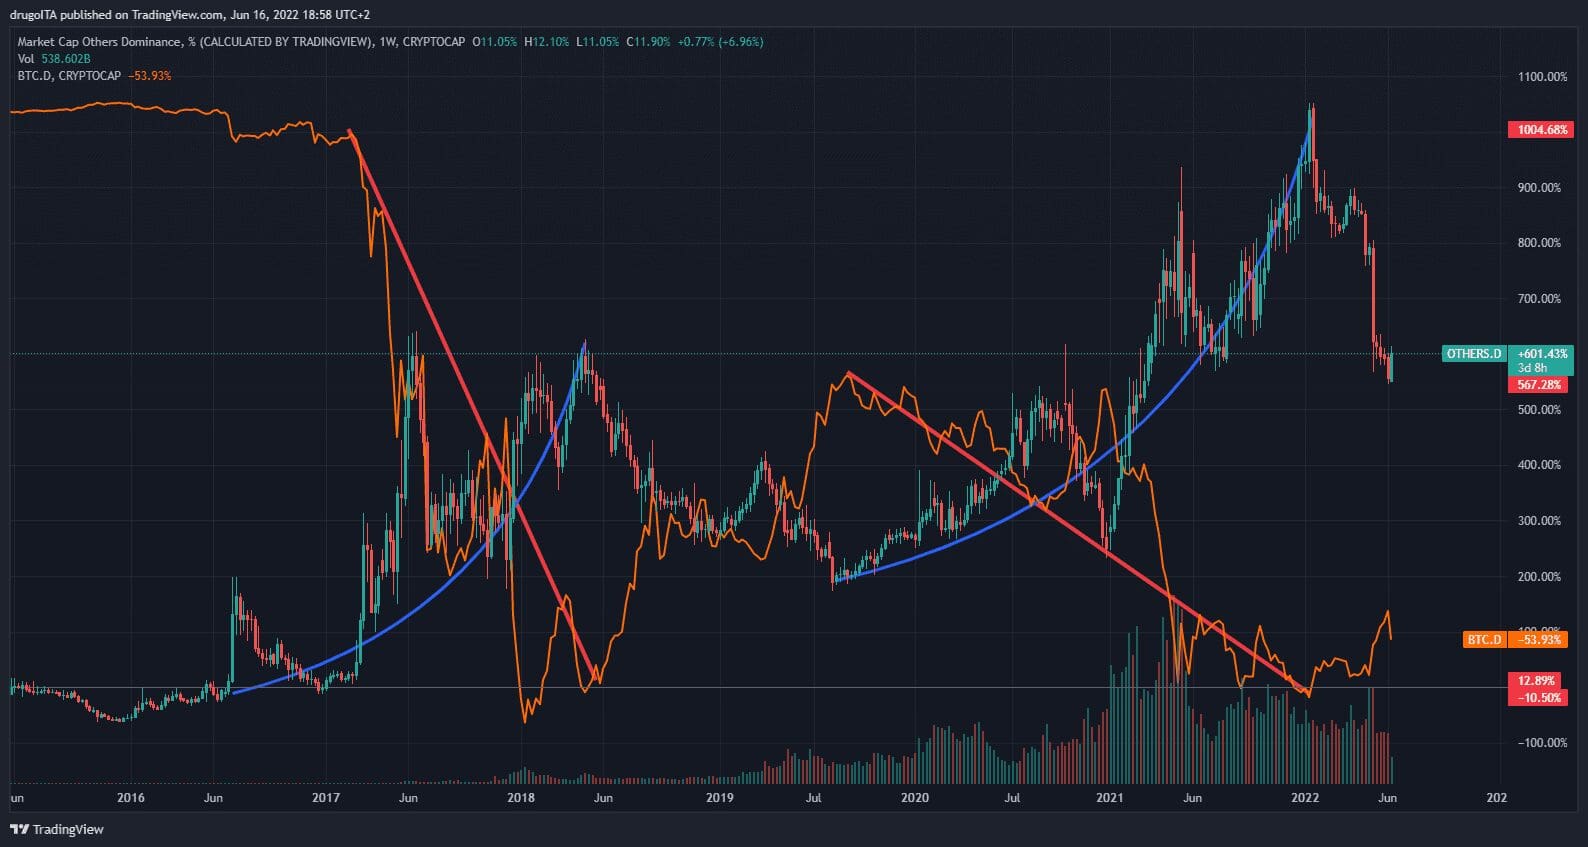
Correlation between indices of the same nature or reflecting similar markets is desirable for trend continuation, when divergences occur, they can be either an indication of a potential trend reversal or a positioning opportunity to exploit an inefficiency that is often filled.
Traditional example:
If the index representing dollar strength DXY signals dollar weakness, it is desirable that the S&P, DOW and NASDAQ perform well
Or if the S&P 500 is performing positively it is logical to think that the DOW will perform similarly well, one being contained within the other
e.g. crypto: if bitcoin’s dominance is in free fall it is desirable that there is a rally in Ether or altcoins going on
Volumes must be consistent with the trend
Any directional movement accompanied by volume growth indicates the strength of the movement itself.
This is true in centralised markets where we have real-time data on the trades that have taken place and the volumes, but this is different for decentralised markets (crypto and CFDs), where we can only have aggregate data from the various exchanges/brokers or even worse we rely on volume data from a single exchange.
This has tended to lose its meaning in recent years: both in centralised markets, due to dark pools, and in crypto markets, due to OTC exchanges.
Directional movements not supported by volumes tend to show little conviction in directionality and are often false breakouts intended to induce the masses towards a fictitious movement (so-called market manipulations)
A Trend remains a Trend until proven otherwise
Statistically, an asset that respects market dominance continues in its primary trend.
This means that only when we have a clear violation of a dominance level can we assess a trend reversal.
Confirmation of a reversal is when not only one of the primary dominance points is violated, but when a series of highs and lows begin to follow one another with directionality opposite to the primary trend.
Conclusions
Virtually every modern version of technical analysis is based on these principles. Our task, as always, is not to blindly trust words spoken by others, but to run to the chart and check the veracity and statistics associated with these assumptions.
By doing so, we will not only have a clearer view of how these words come to life on the chart, but we will also be able to assess whether or not to add this confluence to our operational plan.
Please let us know if you know the story of Charles Dow and if you know any other scholars who have been inspired by his principles. Thank you for your attention and see you next time!