

Introduction
Ralph Nelson Elliott’s 1930s theory, was intended to be a complement to Charles Dow’s theory, an improvement in the understanding of momentum and retracement dynamics.
To do this, in addition to studying markets according to their movements, he tried to apply the concepts of another incredible scholar of mathematics and markets: Fibonacci, we will find his succession in several aspects of Elliott’s theory.
However,both Elliott and Dow agreed on two aspects: the logic of price movements is closely linked to the psychology of market participants and the impulse and retracement figures are fractal, i.e. they can be found on different timeframes.
Regarding the psychological aspect of market participants, we find most 20th century and modern scholars in agreement: the alternation of phases of extreme fear and extreme euphoria gives the market its wave structure.
Index
Opening considerations
Before we get into Elliott’s theory, let us make a few remarks in terms of how to interpret it and what practical applications it might have.
Elliott waves for their own sake are a mere exercise in style.
Clearly, thrown out like this, without contextualisation, my statement could appear presumptuous and erroneous, given the years of study and application made on these concepts by countless traders and investors before me, but for practical purposes, Elliott’s rules do not give us a real advantage or a clear operational line; except for greater detail in the analysis phase.
In order to trade the market, it is fundamental to apply the rules of our trading plan with consistency and discipline, with a backtest behind us that tells us which confluences can give us an advantage. Only in this way can we improve the output of our trading.
We will therefore see below that Elliott, puts very precise stakes on how a trend should behave, both from a graphical, mathematical and temporal point of view.
But there are few assets that actually respond with constancy to these rules, so all we have to do is verify whether some of these concepts are repeated frequently on the assets we are observing and whether we can import them into our operational plan.
Impulsive Waves
Like Dow’s theory, Elliott saw the continuation of a trend’s dominance points as the continuation of the trend; only when one of these points is breached can assessments be made about the reversal of the primary trend.
If you don’t know what we’re talking about, hurry up and read the article on Charles Dow and market trend theory.
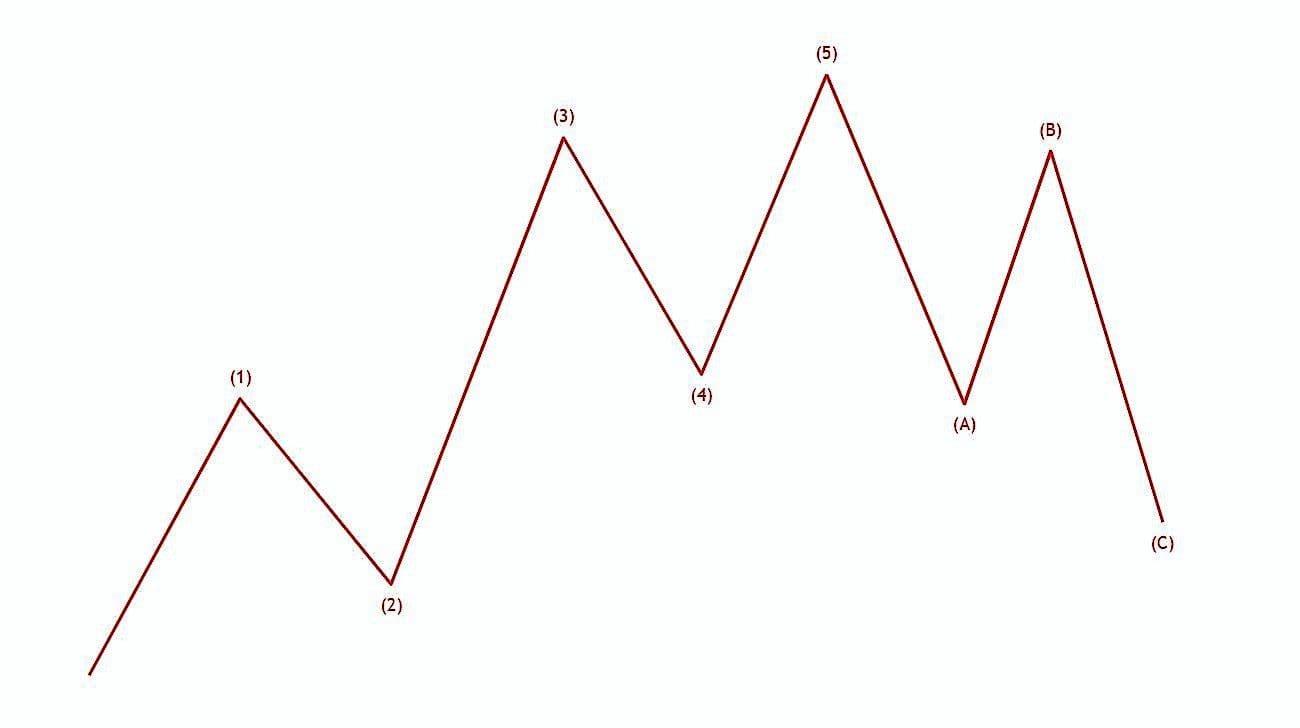
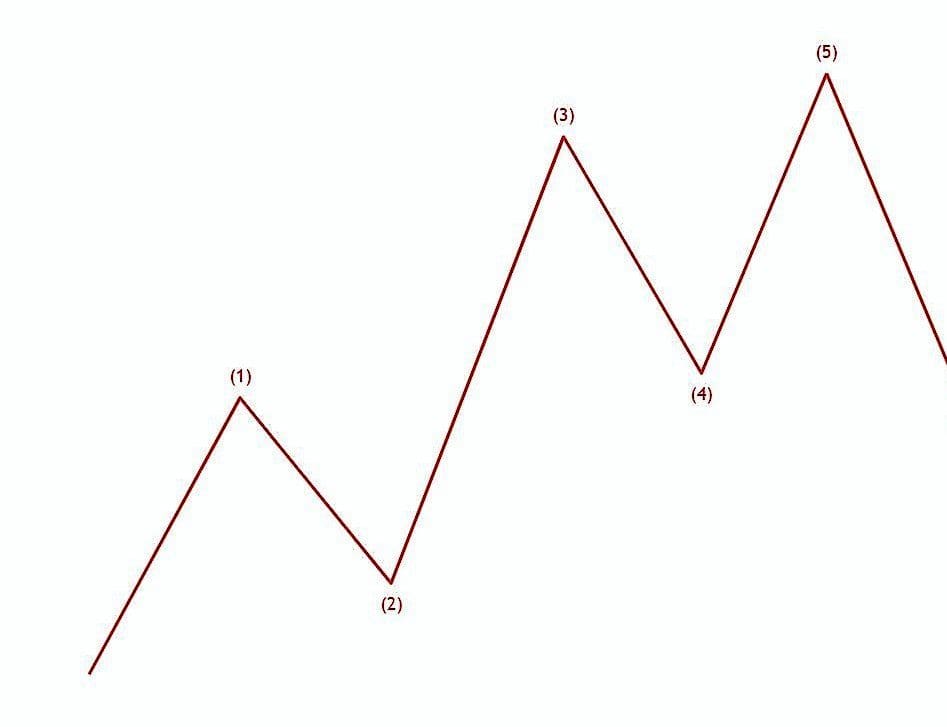
The impulsive waves (1,3 and 5) must respect the highs/lowers of the waves that precede them (as shown in the drawing below), but not only that, the momentum of these waves also tells us about the health of a trend, this aspect has also been covered in depth in one of our articles (Wyckoff Theory).
Wave 3 must be the movement of public participation, hence the most impulsive, but this is often not always respected, in fact sometimes the extension occurs in wave 1 or even wave 5.
It is strange that wave 5 proves to be the most extended of the series, because a healthy trend should lose momentum as it approaches its conclusion, not increase.
While the fact that it is wave 1 that is the most impulsive does not surprise us as it could be a sign of a particular institutional interest in the area from which the impulse started.
Waves 2 and 4 are pullbacks in the primary trend, but we shall see how the concept of fractality can make us revise this assumption.
Retracing Waves
Retracement waves typically represent the secondary trend in Dow theory, by Elliott they are qualified as a 3-wave movement (ABC).
If impulsive waves represent the primary sentiment attached to the asset, euphoria, retracement waves are characterised by the opposite sentiment, fear.
The shapes that these retracements take, the depth in percentage terms of the retracement and the consequences of this ABC wave, clearly tell us about investors’ intentions and what to expect next.
Let’s take a look at the most popular patterns
ZIG-ZAG retracement 5-3-5
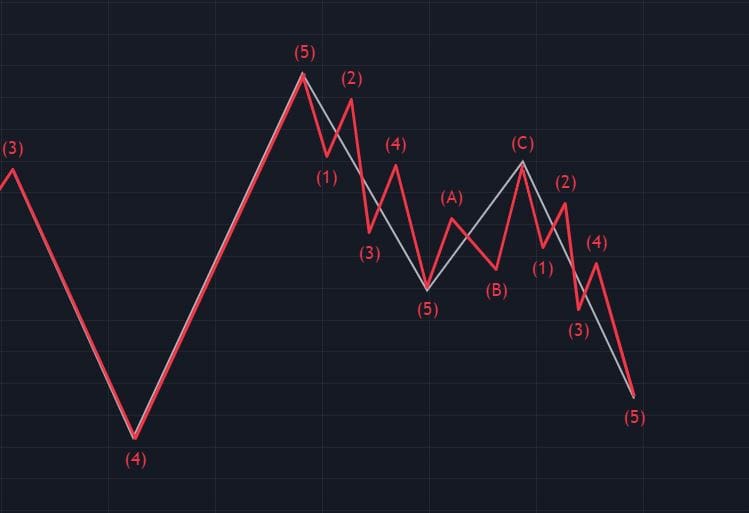
Representing, sort of, the pain of retracements, the exhaustion of the secondary trend can be seen by the decrease in momentum between waves A and C, a decrease in volume or the violation of dominance points caused by the resumption of the primary trend.
If, on the other hand, point C should close below point 4, and this applies to all the figures we will see, this may be a sign of a reversal of the primary trend (always do your own statistics)
- A: primary retracement wave composed of 5 minor waves
- B: Directional wave aligned with the primary trend but less impulsive, never exceeds the maximum of wave 5 and is characterised by three minor waves
- C: final wave of simple ZIG-ZAG retracement (double and triple ZIG-ZAGs exist) also composed of 5 minor waves
FLAT 3-3-5 retracement + BREAKOUT
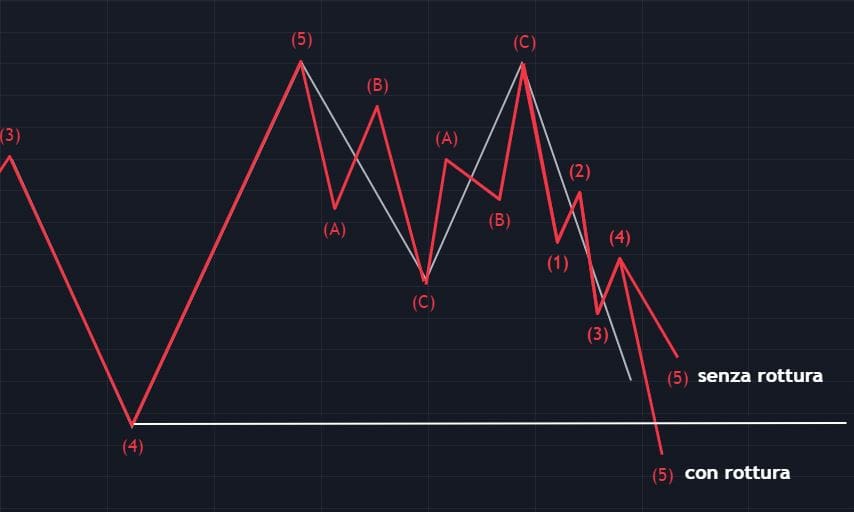
Typical of accumulation distribution processes, after an impulse the market is forced into a range, and only at the moment of a decisive exit confirmed by volumes can we get an idea of the directionality undertaken by the market.
In fact, wave A and B will have the same amplitude (range definition) and will be characterised by 3 minor waves
while wave C will be the one that shows us the market’s intentions, and will be characterised by 5 minor waves:
- a C wave of low impulsiveness and supported by low volumes indicates a potential resumption of the primary trend
- while an impulsive C wave that closes largely below/above the defined range, shows us a clear directional break and a potential trend reversal.
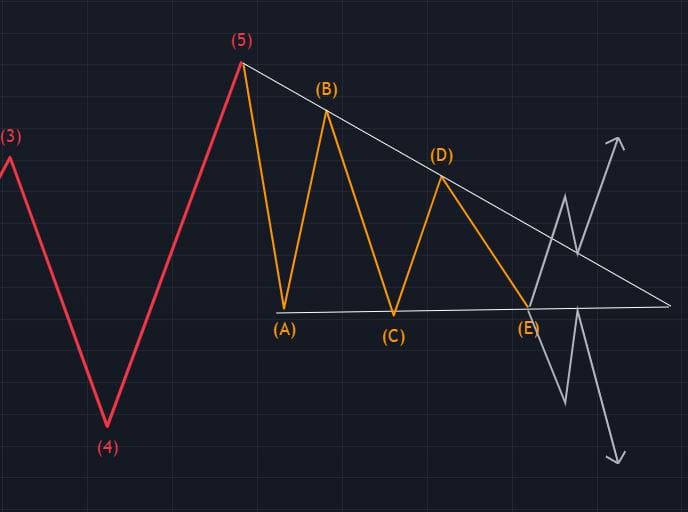
Triangles retracement
This is a typical technical analysis pattern, belonging to the wedge figures, the ascending/descending/symmetrical triangle.
It is indeed very common as a pattern, so I will not dwell particularly on the technical aspect as much as on the importance of contextualisation.
We cannot depend solely on theory without contextualisation.
In this case, the triangles are structured of 5 waves, the extremes of which converge at a common point, the 5 waves ABCDE are composed of 3 minor waves, as shown in the figure below.
It is only at the end of this triangular compression that the trend starts again, taking a precise directionality, and it is here that we must pay more attention and draw our statistics.
How many times does it start without testing the triangle? How many times after breaking the triangle does it test one of the extremes and continue? How often does it break in favour of the primary trend and how often does it break in favour of the reversal? Is the break always a sign of directionality or is it often just a manipulation to take the opposite directionality?
These are the questions we need to be able to answer before trading any type of triangle.
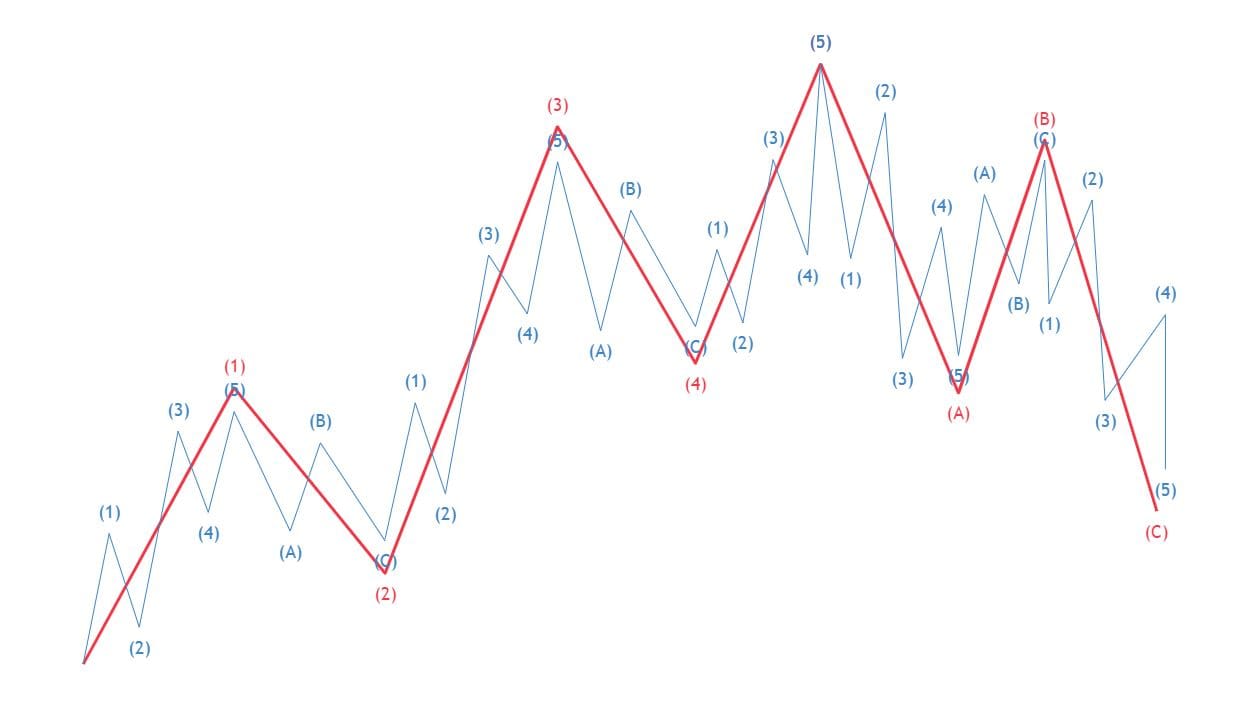
Fractality
Another fundamental and often underestimated aspect of Elliott wave theory is fractality.
This concept starts with the hierarchy of timeframes; we know that each candle of a higher timeframe contains the corresponding candles of the lower timeframe.
All the data and movements that occurred at a lower timeframe are condensed into a single candle of a higher timeframe.
This should already make us understand why a series of 4 weekly candles gives us more relevant information than 4 daily candles: they contain a larger amount of trading and show us the levels accepted by investors over a longer timeframe.
Elliott waves have the same characteristic, what we see as an impulsive wave, for example wave 1, at its core is characterised by 5 impulsive waves and guess what wave 2, is characterised by the ABC retracement of the 5 waves that make up wave 1.
Elliott cycle classification
Here Elliott helps us by subdividing the cycles according to their time extension, also helped by the Fibonacci succession:
- Grand Supercycle (several centuries)
- Supercycle (approximately 40 to 70 years)
- Cycle (1 to 7 years)
- Primary (several months to a few years)
- Intermediate (weeks/months)
- Minor (weeks/months)
- Minute (days)
- Minuette (hours)
- Sub-Minuette (minutes)
Conclusions
The knowledge of the asset and the study of it can lead us to understand the logic that produced a certain movement, if there are the characteristics for the continuation of the trend or for its reversal.
Elliott as I said, has certainly created a style of trend identification and it is indeed effective if contextualised on the right asset, beware however of confirmation bias, it will be easier now to identify Elliott Waves but investment decisions should always be made according to a range of evaluations, not for a single indication. DYOR and DYOStatistics.
I hope this analysis of Elliott’s theory can bring you some new insights and can improve your skills as a technical analyst, let us know what you think in the next live broadcast or on our social channels, thanks for your attention and see you soon.