Japanese candles: the main characteristics
Technical analysis based on the study of Japanese candlesticks has immediate advantages even for the less experienced. This is because it focuses on visualising the imbalance of forces between buyers and sellers in each market session, be it on the stock exchange, forex or crypto.
When the opposing forces of buyers and sellers are in balance, the battle comes to nothing. Neither side prevails over the other and opening and closing, imagined as the front line, remain essentially unchanged.
How to read candlesticks 101?
If you have any doubts about the green candlestick meaning, let’s dispel them right before we begin: in the candlestick chart, green candlesticks signal price growth over the previous session; conversely, red ones indicate a decline.
If either side prevails, prices force open values by developing directionality and volatility.
Every single Japanese candle is made up of these elements, which can answer the question ‘What do Japanese candles indicate?’:
- Main or real body (jittay in Japanese). It links the opening price with the closing price and is represented by the widest part of the candle.
- Shadow (kage) which connect the high and low of the session to the body with a thin line. They are two, one above and one below the body. These figures are respectively called upper shadow (uwakage) and lower shadow (shitakage).
The different combinations of these two elements give distinctive characteristics to each Japanese candle, giving particular meanings and clues as to likely price action developments. All depending on the market condition in which these characteristics manifest themselves.
The matter is very simple on paper, but let’s not be fooled: analysing Japanese candlestick charts requires experience and great care.
If you are asking yourself the basic question ‘How do you read Japanese candlesticks?’, these few lines should already have provided you with a partial answer. Now, however, let us go deeper and discover the most well-known and powerful ones for analysis.
Index
Doji candle
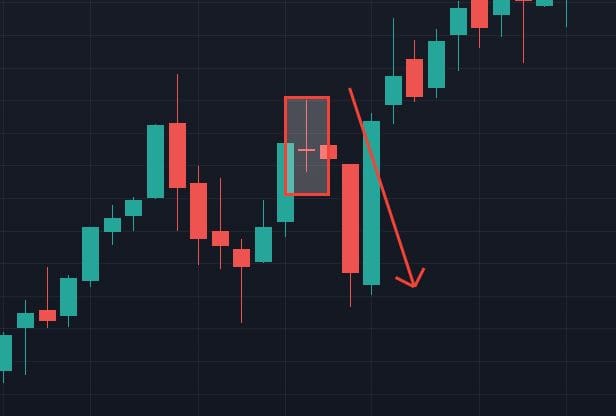
The Doji candle is an important single-candle reversal signal. It assumes particular relevance when it is inserted in other patterns, as in the case of the Gravestone doji or the Morning Star doji, just to name a couple.
The characteristic that makes the doji candle immediately recognisable is that the closing price is the same as the opening price. It therefore has no real body, or has one so small as to be negligible.
If the price excursions of each session are large, it means that the directionality of the market is decided. If a doji is formed in such a range, the directionality is severely weakened due to the uncertainty in the price dynamics.
The formation of a doji candle takes on particular importance if few are encountered in the historical price series. In fact, in the case of a security where price excursions between opening and closing are usually significant, i.e. where market directionality is firm, the formation of a candlestick doji implies uncertainty in price dynamics.
During an uptrend, the presence of doji candlesticks can, in all likelihood, represent a reversal signal, especially if it occurs after a Marubozu, i.e. after a rapid rise.
This means that the bullish strength of the market, after possible excesses that brought it into an overbought situation, has undergone a decisive downsizing, with a consequent moment of uncertainty. It is frequently said that after a doji the market collapses under its own weight.
In reality, the fact that the doji candle represents a moment of transition, of equilibrium between the bull and bear forces, should not necessarily be considered synonymous with reversal. The trend could resume in the same direction with unchanged momentum, indicating that the market has resolved its temporary indecision.
The best thing is undoubtedly to wait for the confirmation of the next Japanese candle. Indeed, it will be able to clarify unequivocally the new path taken by the price movement.
The opposite situation, i.e. a downtrend, does not have the same predictive power.
It is important to stress that the potential reversal signal is more reliable if we are in the presence of an uptrend, whereas it is weaker in a downtrend.

Japanese Marubozu Candle
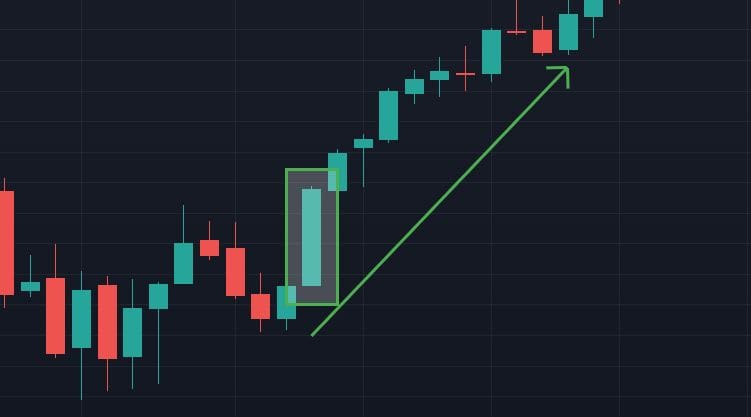
When one market force prevails over the other and there is a close on the highs or lows, it is a strong signal as to the directionality being taken.
The Marubozu (bullish or bearish) are Japanese candles similar to the long lines (classic directional candles) but, unlike the latter, are devoid of the upper and lower shadows having the closing and opening prices corresponding to the extreme values.
The bullish marubozu is strongly bullish. Conversely, the bearish marubozu is bearish. Both are sought after to confirm reversal patterns consisting of multiple trading candles or the forcing of technical levels.
If the marubozu has a shadow at the opening price it is called an opening marubozu, if the shadow is at the closing price it is called a closing marubozu.
The meaning of these two candles is the same as for marubozu without a shadow. Obviously, the shadow in opening will leave unchanged the force of the candle while if it presents itself in closing it will reduce the force of the signal.

Engulfing candlestick
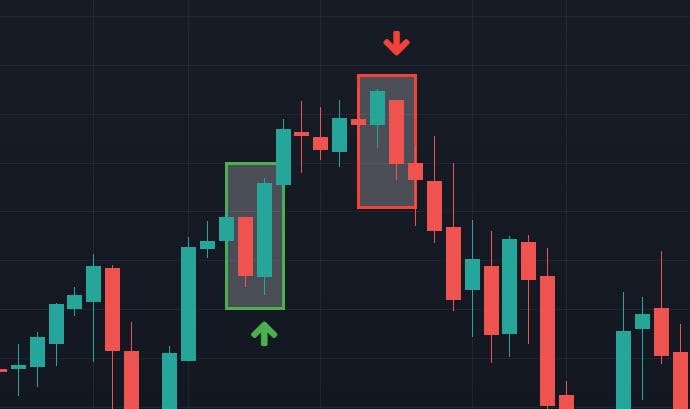
An easy formation to spot is the engulfing, which can be either bullish or bearish, with the only difference being the order of the colours.
In the case of bullish engulfing candlestick patterns we have, after a downtrend, a first red coloured candle. This is followed by a second one of green colour with amplitude greater than the previous one, such that the first real body is contained entirely in the second.
In the case of a bearish candlestick engulfing pattern we have first a candle of green colour with the real body contained in the second of red colour, originating from a bullish trend.
The first real body, the smallest, represents the deceleration of the current trend; the second, the largest, indicates the new direction of the market.

The Hammer candlestick
The easiest reversal pattern to recognise consists of a single candle called a hammer and contains bullish candlestick implications.
These candles are part of the lower shadow family, characterised by the position of the real body at the top of the figure forming a large lower shadow.
This type of Japanese candle has a narrow real body and lower shadow usually at least twice as large. The greater the lower shadow relative to the real body, the better the reliability of the signal.
When placed in a defined trend, these reversal patterns provide signals of weakening of the current movement, uncertainty, potential reversal or correction of the primary trend.
It is essential to look for confirmation of the change in trend direction in the candles that follow, which after the hammer must start the uptrend.
A hammer can be recognised by three characteristics:
- The real body must form in the upper part of the session range. The colour of the body is considered of secondary importance;
- The lower shadow must be at least twice the height of the real body;
- There should be no upper shadow, or if there is, it should be very short, at most 10% of the real body.
Generally, the hammer figure occurs when the market is in the midst of its bearish strength , putting a strain on the bears in the market.
Furthermore, a very good confirmation of a reversal would be an upward breakout in the next session of the price level indicated by the hammer high.
A candlestick hammer must be followed by a candle that does not close below the opening of the pattern. Otherwise, the signal will be weakened.
Japanese Hanging-Man candles
If the hammer is a bullish reversal signal, consisting of a single candle, its bearish twin is called a hang-man (or hanging-man)
The term hanging-man can be translated as ‘hanging man’ because of the Japanese candle’s resemblance to a hanged man with ‘dangling legs’;
The greater the lower shadow relative to the real body, the better the reliability of the signal.
When embedded in a defined trend, these reversal patterns provide signals of weakening of the current movement, uncertainty, potential reversal or correction of the primary trend.
If, after a strong reversal signal, a candle is formed that expresses a trend contrary to the signal, one must proceed with extreme caution before considering the current trend exhausted.
Negligible is the colour of the figure, as the essential element underlying the reversal is precisely the difference between opening and closing, not the direction.
A hanging-man candle can be recognised by three characteristics:
- The real body must form in the upper part of the session range. The colour of the body is considered of secondary importance;
- The lower shadow must be at least twice the height of the real body;
- There shouldbe no upper shadow, or if there is, it should be very short, no more than 10% of the real body.
Generally, the Hanging Man figure occurs when the market is in the midst of its bullish strength, putting the bulls’ strength in the market to the test, despite the fact that the close is back near the session highs.
The defeat of the bullish market has not yet been established: a good confirmation would be if in the following session the opening is lower than the previous close.
"Once the Hanging Man is confirmed, it is said that you hang if you have long positions"
Japanese candlestick pattern: conclusions
Japanese candlestick trading analysis combines the main candlesticks together to reinforce the bias towards a given reversal or continuation situation. The candlestick chart is the most popular among investors and traders due to its ability to provide so much information at a glance.
There is a tendency to rarely take a single candlestick as a signal, instead combining it with the next one or with groups of three to make the signal stronger and with more confirmation.
Candlestick chart analysis combined with volumetric analysis provides an excellent real-time view of price trends. This type of interpretation is often successful, as it tends to intercept movements at the origin.
There are innumerable possible combinations and, as we said, it is a very ancient type of analysis and rich in anecdotes linked to Japanese culture. In any case, you now know a little more about the Japanese candlestick chart.
If you want to learn the basics of how to read a chart, take a look at our article on technical analysis.

