Analysis and Price Action
We have arrived at a very important point in understanding the dynamics that move the market, in the previous sections we have seen how to identify market structure, what indicators and patterns distinguish the various phases of price movement of an asset and what are the most “token” zones for directional changes.
All that remains for us then is to analyze even further, what dynamics occur in reversal zones and what characteristics may or may not validate our view on the continuation of a trend.
As we have seen, market trends are characterized by alternating directional highs and lows: rising if the trend is bullish, falling if the trend is bearish.
Whereas when the market is in a condition of consolidation/ranging market, these crucial points are not well defined, but the extremes within which the market is stationing, often bouncing between one extreme and the other, are well identifiable.
Identifying these price reaction zones is critical to getting a correct view of the market direction and possible entry areas for our trading plan.
Index
Operating Time Frame
Each Trader should set his analysis and operations according to how much time he has to devote to the market.
The shorter the time (a few hours a day), the more one should select high operational Time Frames, freeing oneself from intraday noise and focusing only on swing and macrodirectional movements; on the other hand, if we can devote more time to the study of price action (several hours every day), the use of lower Time Frames provides a more detailed and responsive day-by-day view.
Recommended Time Frames for the various types of trading are:
- Scalper: M5, M15, H1
- Swing Trader: H1, H4, D
- Long Term Trader: D, W, M
Here we have delved into price action and market structure.
Breakout and acceptance
Once we have defined our operating time frame and established the market condition (trend or range), all that remains is to validate our directional bias through distinctive signals.
One of the ways in which we can determine whether a market is controlled by bulls or bears is to analyze price action:
- The alternation of rising highs and rising lows or vice versa
- The detection of a structural breakout
- The observance of supply/demand zones
Structural Breakout is defined as any movement that closes the candlestick body above the previous minimum/maximum, depending on whether it is a Long Acceptance or a Short Acceptance.
Acceptance is valid only when the candlestick body closes above the attended level.
The closing of the candle indicates the intentionality of market participants to accept that price, while a wick/shadow demonstrate a rejection for that particular price level resulting in reverse market pressure.
Let’s look at some graphic examples:

Market dominance
In order to fully understand the importance of the breakout, one must also be clear about the concept of Dominance, which would be like saying you know how to make carbonara without using guanciale and pecorino cheese.
Dominance is nothing more than that area of the chart where the volumes necessary to make acceptance above a level have entered, confirming the directionality of the trend.
We see market movements, through candlestick charting, but this is only a reworking of the orders that have occurred on a specific asset, in a selected time frame.
As we saw earlier, the market moves through the creation of waves, impulsive or retracement waves.
Retracement waves tend to be slower than impulsive ones, since in a trend that respects directionality it is the rapid movements that demonstrate interest in continuation.
It is important, therefore, to understand where the orders that allowed an acceptance entered, as those who allowed the trend to be created or continued will reside in that area.
Let us therefore look at how to correctly identify these zones.

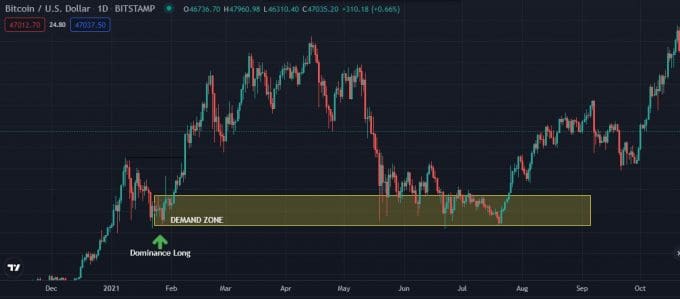
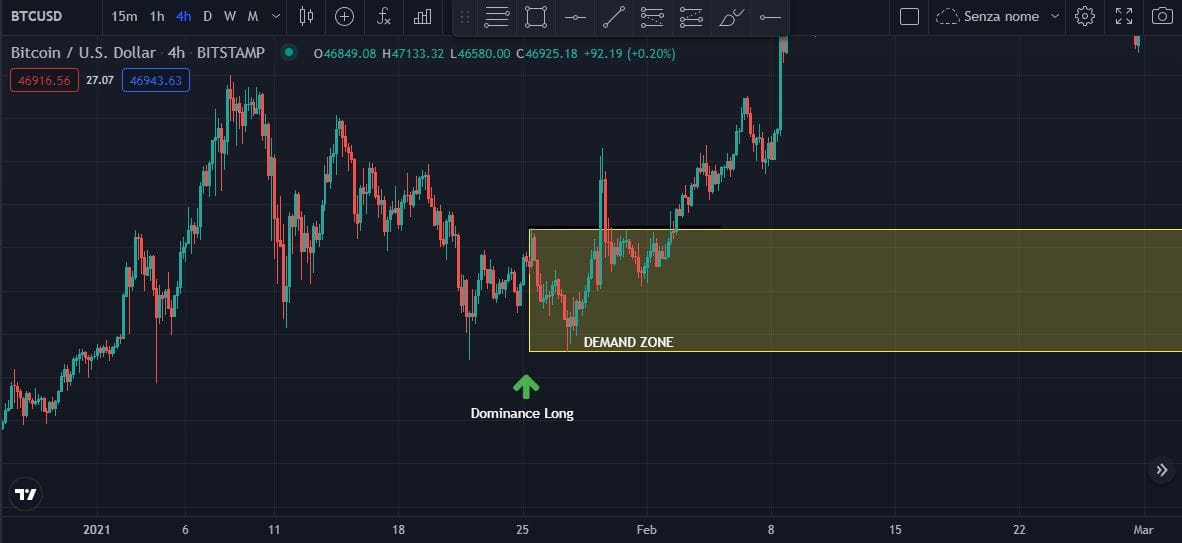
How to identify a demand zone
Identifying the area where the retracement could run out, realigning with the directionality of the trend, is very important, in order to get the best possible risk return from our trading plan.
So we will now go over some discretionary rules for identifying the Demand zone.

Let us look at the different steps that led us to identify Dominance and Demand Zone:
- We qualified our bullish dominance through the identification of the bullish breakout with acceptance.
- Next, we plotted a zone to identify the trading range into which the volumes that enabled the bullish excursion entered.
- This zone tends to be drawn from the reference low of the impulse to the last high of the retracement.

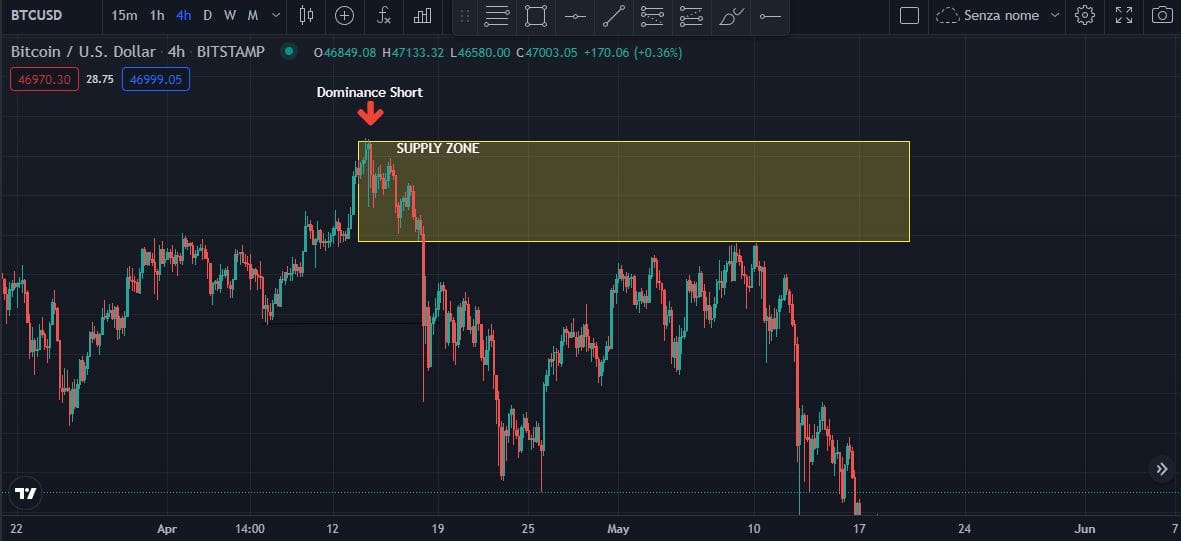
How to identify a supply zone
The same point made about the Demand Zone, is important when our bias is not bullish but bearish.
In this case our focus will be to identify in which zone the volumes necessary to create the bearish breakout and presumably the creation of a short trend have entered .
We always remember that price action analysis is only one of many interpretive views of the market and must be added to the understanding of different dynamics for the correct identification of a zone or trend.
We see that on this occasion, too, the steps for identifying Supply Zones are the same:
- We qualified our Short dominance through the identification of the bearish breakout with acceptance.
- Next, we plotted a zone to identify the trading range into which the volumes that allowed the bearish May shot entered.
- This zone tends to be drawn from the reference high to the last low of the impulse.

Conclusions
Let us summarize the terminology used in this article:
LONG ACCEPTANCE: we have an actual bullish break out, when in higher Time Frames (usually closing D if not W) we have a closing candle above the previous high
SHORT ACCEPTANCE: we have an established short break out when, again in high time frames, the bearish reference candle closes below the previous low.
DOMINANCE: origin of the impulse from which an effective structural breakout started, last point within which the movement is respected.
DEMAND ZONE : zone drawn in the vicinity of the long dominance, in which the orders that enabled the bullish movement reside. In this zone there is a higher probability that the retracement will be broken and there will be a structural realignment.
SUPPLY ZONE: zone drawn near the short dominance, in which the orders that allowed the bearish movement reside. In this zone there is a higher probability that the retracement will stop and there will be a structural realignment.
At this point you just have to go to chart and actually test the effectiveness of what I have reported to you, in this world it is always important to do your own research (DYOR) and testing.
For all charting and analysis the best software, with more features and that gives access to every market is TradingView; the software has a basic, free version that allows a minimal use approach while if you would like to access the higher floors that guarantee several more features, here is our referral code that grants you up to $30 off.

